Tyson Foods 2014 Annual Report Download - page 61
Download and view the complete annual report
Please find page 61 of the 2014 Tyson Foods annual report below. You can navigate through the pages in the report by either clicking on the pages listed below, or by using the keyword search tool below to find specific information within the annual report.-
 1
1 -
2
-
3
-
4
-
5
-
6
-
7
-
8
-
9
-
10
-
11
-
12
-
13
-
14
-
15
-
16
-
17
-
18
-
19
-
20
-
21
-
22
-
23
-
24
-
25
-
26
-
27
-
28
-
29
-
30
-
31
-
32
-
33
-
34
-
35
-
36
-
37
-
38
-
39
-
40
-
41
-
42
-
43
-
44
-
45
-
46
-
47
-
48
-
49
-
50
-
 51
51 -
 52
52 -
 53
53 -
 54
54 -
 55
55 -
 56
56 -
 57
57 -
 58
58 -
 59
59 -
 60
60 -
 61
61 -
 62
62 -
 63
63 -
 64
64 -
 65
65 -
 66
66 -
 67
67 -
 68
68 -
 69
69 -
 70
70 -
 71
71 -
72
-
73
-
74
-
75
-
76
-
77
-
78
-
79
-
80
-
81
-
82
-
83
-
84
-
85
-
86
-
87
-
88
-
89
-
90
-
91
-
92
-
93
-
94
-
95
-
96
-
97
-
98
-
99
-
100
-
101
-
102
-
103
-
104
-
105
-
106
-
107
-
108
-
109
-
110
-
111
-
112
-
113
-
114
-
115
-
116
-
117
-
118
-
119
-
120
-
121
-
122
-
123
-
124
-
125
-
126
-
127
-
128
-
129
-
130
-
131
-
132
-
133
-
134
-
135
-
136
-
137
-
138
-
139
-
140
-
141
-
142
-
143
-
144
-
145
-
146
-
147
-
148
-
149
-
150
-
151
-
152
-
153
-
154
-
155
-
156
-
157
-
158
-
159
-
160
-
161
-
162
-
163
-
164
-
165
-
166
-
167
-
168
-
169
-
170
-
171
-
172
-
173
-
174
-
175
-
176
-
177
-
178
-
179
-
180
-
181
-
182
-
183
-
184
-
185
-
186
-
187
-
188
-
189
-
190
-
191
-
192
-
193
-
194
-
195
-
196
-
197
-
198
-
199
-
200
-
201
-
202
-
203
-
204
-
205
-
206
-
207
-
208
-
209
-
210
-
211
-
212
-
213
-
214
-
215
-
216
-
217
-
218
-
219
-
220
-
221
-
222
-
223
-
224
-
225
-
226
-
227
-
228
 |
 |

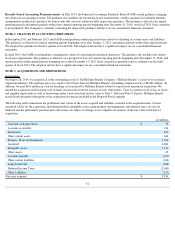
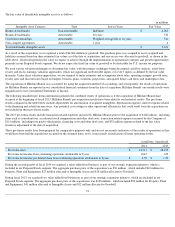
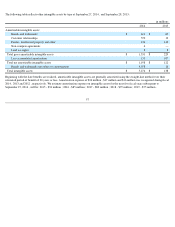
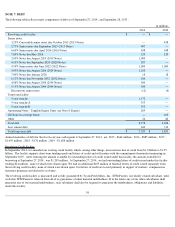
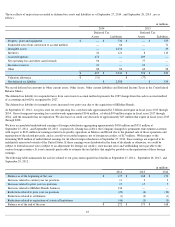
The fair value of identifiable intangible assets is as follows:
As a result of the acquisition, we recognized a total of $4,804 million of goodwill. The purchase price was assigned to assets acquired and
liabilities assumed based on their estimated fair values as of the date of acquisition, and any excess was allocated to goodwill, as shown in the
table above. Goodwill represents the value we expect to achieve through the implementation of operational synergies and growth opportunities
primarily in our Prepared Foods segment. We do not expect the final fair value of goodwill to be deductible for U.S. income tax purposes.
We used various valuation techniques to determine fair value, with the primary techniques being discounted cash flow analysis, relief-from-
royalty and excess earnings valuation approaches, which use significant unobservable inputs, or Level 3 inputs, as defined by the fair value
hierarchy. Under these valuation approaches, we are required to make estimates and assumptions about sales, operating margins, growth rates,
royalty rates and discount rates based on budgets, business plans, economic projections, anticipated future cash flows and marketplace data.
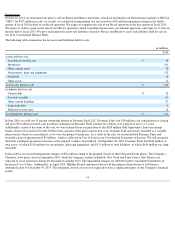
The acquisition of Hillshire Brands was accounted for using the acquisition method of accounting, and consequently, the results of operations
for Hillshire Brands are reported in our consolidated financial statements from the date of acquisition. Hillshire Brands' one month results were
insignificant to our Consolidated Statements of Income.
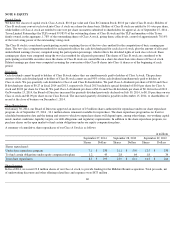
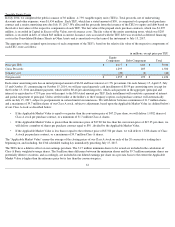
The following unaudited pro forma information presents the combined results of operations as if the acquisition of Hillshire Brands had
occurred at the beginning of fiscal 2013. Hillshire Brands' pre-acquisition results have been added to our historical results. The pro forma
results contained in the table below include adjustments for amortization of acquired intangibles, depreciation expense, interest expense related
to the financing and related income taxes. Any potential cost savings or other operational efficiencies that could result from the acquisition are
not included in these pro forma results.
The 2013 pro forma results include transaction related expenses incurred by Hillshire Brands prior to the acquisition of $168 million
, including
items such as consultant fees, accelerated stock compensation and other deal costs; transaction related expenses incurred by the Company of
$115 million , including fees paid to third parties, financing costs and other deal costs; and $32 million expense related to the fair value
inventory adjustment at the date of acquisition.
These pro forma results have been prepared for comparative purposes only and are not necessarily indicative of the results of operations as they
would have been had the acquisitions occurred on the assumed dates, nor is it necessarily an indication of future operating results.
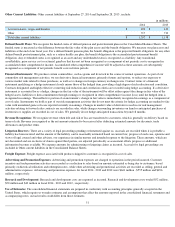
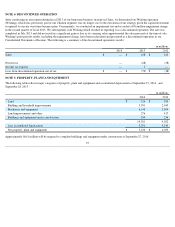
During the second quarter of fiscal 2014 we acquired a value-added food business as part of our strategic expansion initiative, which is
included in our Prepared Foods segment. The aggregate purchase price of the acquisition was $56 million , which included $12 million for
Property, Plant and Equipment, $27 million allocated to Intangible Assets and $18 million allocated to Goodwill.
During fiscal 2013, we acquired two value-added food businesses as part of our strategic expansion initiative, which are included in our
Prepared Foods segment. The aggregate purchase price of the acquisitions was $106 million , which included $50 million for Property, Plant
and Equipment, $41 million allocated to Intangible Assets and $12 million allocated to Goodwill.
53
in millions
Intangible Asset Category
Type
Life in Years
Fair Value
Brands & trademarks
Non-amortizable
Indefinite
$
4,062
Brands & trademarks
Amortizable
20 years
532
Customer relationships
Amortizable
Weighted average life of 16 years
541
Non-compete agreements
Amortizable
1 year
6
Total identifiable intangible assets
$
5,141
in millions (unaudited)
2014
2013
Pro forma sales
$
41,311
$
38,195
Pro forma net income from continuing operations attributable to Tyson
1,047
655
Pro forma net income per diluted share from continuing operations attributable to Tyson
$
2.50
$
1.52