Tyson Foods 2014 Annual Report Download - page 37
Download and view the complete annual report
Please find page 37 of the 2014 Tyson Foods annual report below. You can navigate through the pages in the report by either clicking on the pages listed below, or by using the keyword search tool below to find specific information within the annual report.-
 1
1 -
2
-
3
-
4
-
5
-
6
-
7
-
8
-
9
-
10
-
11
-
12
-
13
-
14
-
15
-
16
-
17
-
18
-
19
-
20
-
21
-
22
-
23
-
24
-
25
-
26
-
 27
27 -
 28
28 -
 29
29 -
 30
30 -
 31
31 -
 32
32 -
 33
33 -
 34
34 -
 35
35 -
 36
36 -
 37
37 -
 38
38 -
 39
39 -
 40
40 -
 41
41 -
 42
42 -
 43
43 -
 44
44 -
 45
45 -
 46
46 -
 47
47 -
48
-
49
-
50
-
51
-
52
-
53
-
54
-
55
-
56
-
57
-
58
-
59
-
60
-
61
-
62
-
63
-
64
-
65
-
66
-
67
-
68
-
69
-
70
-
71
-
72
-
73
-
74
-
75
-
76
-
77
-
78
-
79
-
80
-
81
-
82
-
83
-
84
-
85
-
86
-
87
-
88
-
89
-
90
-
91
-
92
-
93
-
94
-
95
-
96
-
97
-
98
-
99
-
100
-
101
-
102
-
103
-
104
-
105
-
106
-
107
-
108
-
109
-
110
-
111
-
112
-
113
-
114
-
115
-
116
-
117
-
118
-
119
-
120
-
121
-
122
-
123
-
124
-
125
-
126
-
127
-
128
-
129
-
130
-
131
-
132
-
133
-
134
-
135
-
136
-
137
-
138
-
139
-
140
-
141
-
142
-
143
-
144
-
145
-
146
-
147
-
148
-
149
-
150
-
151
-
152
-
153
-
154
-
155
-
156
-
157
-
158
-
159
-
160
-
161
-
162
-
163
-
164
-
165
-
166
-
167
-
168
-
169
-
170
-
171
-
172
-
173
-
174
-
175
-
176
-
177
-
178
-
179
-
180
-
181
-
182
-
183
-
184
-
185
-
186
-
187
-
188
-
189
-
190
-
191
-
192
-
193
-
194
-
195
-
196
-
197
-
198
-
199
-
200
-
201
-
202
-
203
-
204
-
205
-
206
-
207
-
208
-
209
-
210
-
211
-
212
-
213
-
214
-
215
-
216
-
217
-
218
-
219
-
220
-
221
-
222
-
223
-
224
-
225
-
226
-
227
-
228
 |
 |
32
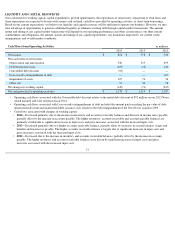
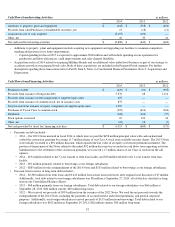
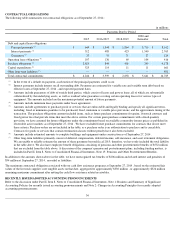
Cash Flows from Investing Activities
in millions
2014
2013
2012
Additions to property, plant and equipment
$
(632
)
$
(558
)
$
(690
)
Proceeds from sale/(Purchases) of marketable securities, net
15
(18
)
(11
)
Acquisitions, net of cash acquired
(8,193
)
(106
)
—
Other, net
10
39
41
Net cash used for investing activities
$
(8,800
)
$
(643
)
$
(660
)
•
Additions to property, plant and equipment include acquiring new equipment and upgrading our facilities to maintain competitive
standing and position us for future opportunities.
• Capital spending for fiscal 2015 is expected to approximate $900 million and will include spending on our operations for
production and labor efficiencies, yield improvements and sales channel flexibility.
• Acquisitions in fiscal 2014 related to acquiring Hillshire Brands and an additional value-added food business as part of our strategy to
accelerate growth in our prepared foods sales. Both of these acquisitions are included in the Prepared Foods segment. For further
description regarding these transactions refer to Part II, Item 8, Notes to Consolidated Financial Statements, Note 3: Acquisitions and
Dispositions.
Cash Flows from Financing Activities
in millions
2014
2013
2012
Payments on debt
$
(639
)
$
(91
)
$
(993
)
Proceeds from issuance of long-term debt
5,576
68
1,116
Proceeds from issuance of debt component of tangible equity units
205
—
—
Proceeds from issuance of common stock, net of issuance costs
873
—
—
Net proceeds from issuance of equity component of tangible equity units
1,255
—
—
Purchases of Tyson Class A common stock
(295
)
(614
)
(264
)
Dividends
(104
)
(104
)
(57
)
Stock options exercised
67
123
34
Other, net
(23
)
18
(7
)
Net cash provided by (used for) financing activities
$
6,915
$
(600
)
$
(171
)
• Payments on debt included
–
• 2014 – Our 2013 Notes matured in fiscal 2014 at which time we paid the $458 million principal value with cash on hand and
settled the conversion premium by issuing 11.7 million shares of our Class A stock from available treasury shares. The 2013 Notes
were initially recorded at a $92 million discount, which equaled the fair value of an equity conversion premium instrument. The
portion of the payment of the Notes related to the initial $92 million discount was recorded in cash flows from operating activities.
Simultaneous to the settlement of the conversion premium, we received 11.7 million shares of our Class A stock from the call
options.
• 2014 – $194 million related to the 5-year tranche A term loan facility and $30 million related to the 3-year tranche term loan
facility.
• 2013 – $
91 million primarily related to borrowings at our foreign subsidiaries.
• 2012 – $
885 million for the extinguishment of the 2014 Notes and $103 million related to borrowings at our foreign subsidiaries.
• Proceeds from issuance of long-term debt included
–
• 2014 – $2,300 million from term loans and $3,243 million from senior unsecured notes after original issue discounts of $7 million.
Additionally, total debt related to our foreign subsidiaries was $8 million at September 27, 2014, all of which is classified as long-
term in our Consolidated Balance Sheets.
• 2013 – $68 million primarily from our foreign subsidiaries. Total debt related to our foreign subsidiaries was $60 million at
September 28, 2013 ($40 million current, $20 million long-term).
• 2012 – We received net proceeds of $995 million from the issuance of the 2022 Notes. We used the net proceeds towards the
extinguishment of the 2014 Notes, including the payments of accrued interest and related premiums, and general corporate
purposes. Additionally, our foreign subsidiaries received proceeds of $115 million from borrowings. Total debt related to our
foreign subsidiaries was $102 million at September 29, 2012 ($62 million current, $40 million long-term).