Tyson Foods 2014 Annual Report Download - page 78
Download and view the complete annual report
Please find page 78 of the 2014 Tyson Foods annual report below. You can navigate through the pages in the report by either clicking on the pages listed below, or by using the keyword search tool below to find specific information within the annual report.-
 1
1 -
2
-
3
-
4
-
5
-
6
-
7
-
8
-
9
-
10
-
11
-
12
-
13
-
14
-
15
-
16
-
17
-
18
-
19
-
20
-
21
-
22
-
23
-
24
-
25
-
26
-
27
-
28
-
29
-
30
-
31
-
32
-
33
-
34
-
35
-
36
-
37
-
38
-
39
-
40
-
41
-
42
-
43
-
44
-
45
-
46
-
47
-
48
-
49
-
50
-
51
-
52
-
53
-
54
-
55
-
56
-
57
-
58
-
59
-
60
-
61
-
62
-
63
-
64
-
65
-
66
-
67
-
 68
68 -
 69
69 -
 70
70 -
 71
71 -
 72
72 -
 73
73 -
 74
74 -
 75
75 -
 76
76 -
 77
77 -
 78
78 -
 79
79 -
 80
80 -
 81
81 -
 82
82 -
 83
83 -
 84
84 -
 85
85 -
 86
86 -
 87
87 -
 88
88 -
89
-
90
-
91
-
92
-
93
-
94
-
95
-
96
-
97
-
98
-
99
-
100
-
101
-
102
-
103
-
104
-
105
-
106
-
107
-
108
-
109
-
110
-
111
-
112
-
113
-
114
-
115
-
116
-
117
-
118
-
119
-
120
-
121
-
122
-
123
-
124
-
125
-
126
-
127
-
128
-
129
-
130
-
131
-
132
-
133
-
134
-
135
-
136
-
137
-
138
-
139
-
140
-
141
-
142
-
143
-
144
-
145
-
146
-
147
-
148
-
149
-
150
-
151
-
152
-
153
-
154
-
155
-
156
-
157
-
158
-
159
-
160
-
161
-
162
-
163
-
164
-
165
-
166
-
167
-
168
-
169
-
170
-
171
-
172
-
173
-
174
-
175
-
176
-
177
-
178
-
179
-
180
-
181
-
182
-
183
-
184
-
185
-
186
-
187
-
188
-
189
-
190
-
191
-
192
-
193
-
194
-
195
-
196
-
197
-
198
-
199
-
200
-
201
-
202
-
203
-
204
-
205
-
206
-
207
-
208
-
209
-
210
-
211
-
212
-
213
-
214
-
215
-
216
-
217
-
218
-
219
-
220
-
221
-
222
-
223
-
224
-
225
-
226
-
227
-
228
 |
 |
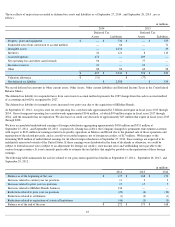
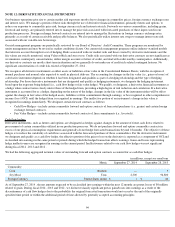
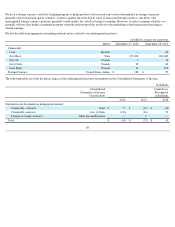
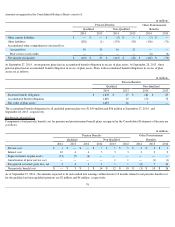
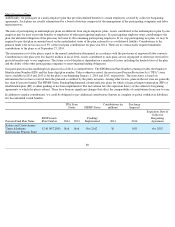
Assets and Liabilities Measured at Fair Value on a Recurring Basis
The fair value hierarchy requires the use of observable market data when available. In instances where the inputs used to measure fair value fall
into different levels of the fair value hierarchy, the fair value measurement has been determined based on the lowest level input significant to
the fair value measurement in its entirety. Our assessment of the significance of a particular item to the fair value measurement in its entirety
requires judgment, including the consideration of inputs specific to the asset or liability.
The following tables set forth by level within the fair value hierarchy our financial assets and liabilities accounted for at fair value on a
recurring basis according to the valuation techniques we used to determine their fair values:
70
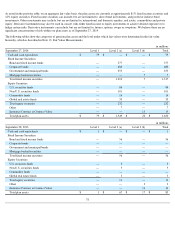
in millions
September 27, 2014
Level 1
Level 2
Level 3
Netting (a)
Total
Assets:
Commodity Derivatives
$
—
$
59
$
—
$
(
50
)
$
9
Foreign Exchange Forward Contracts
—
—
—
—
—
Available for Sale Securities:
Current
—
1
—
—
1
Non-current
1
24
67
—
92
Deferred Compensation Assets
15
218
—
—
233
Total Assets
$
16
$
302
$
67
$
(50
)
$
335
Liabilities:
Commodity Derivatives
$
—
$
158
$
—
$
(
148
)
$
10
Foreign Exchange Forward Contracts
—
2
—
—
2
Total Liabilities
$
—
$
160
$
—
$
(
148
)
$
12
September 28, 2013
Level 1
Level 2
Level 3
Netting (a)
Total
Assets:
Commodity Derivatives
$
—
$
29
$
—
$
(
21
)
$
8
Foreign Exchange Forward Contracts
—
3
—
(
1
)
2
Available for Sale Securities:
Current
—
1
—
—
1
Non-current
4
24
65
—
93
Deferred Compensation Assets
23
191
—
—
214
Total Assets
$
27
$
248
$
65
$
(22
)
$
318
Liabilities:
Commodity Derivatives
$
—
$
101
$
—
$
(
101
)
$
—
Foreign Exchange Forward Contracts
—
1
—
—
1
Total Liabilities
$
—
$
102
$
—
$
(
101
)
$
1
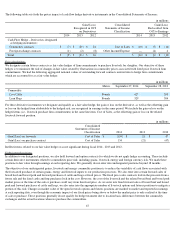
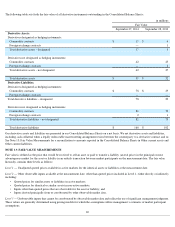
(a) Our derivative assets and liabilities are presented in our Consolidated Balance Sheets on a net basis. We net derivative assets and
liabilities, including cash collateral, when a legally enforceable master netting arrangement exists between the counterparty to a
derivative contract and us. At September 27, 2014 , and September 28, 2013 , we had posted with various counterparties $98 million
and $79 million , respectively, of cash collateral related to our commodity derivatives and held no cash collateral.