Tyson Foods 2014 Annual Report Download - page 57
Download and view the complete annual report
Please find page 57 of the 2014 Tyson Foods annual report below. You can navigate through the pages in the report by either clicking on the pages listed below, or by using the keyword search tool below to find specific information within the annual report.-
 1
1 -
2
-
3
-
4
-
5
-
6
-
7
-
8
-
9
-
10
-
11
-
12
-
13
-
14
-
15
-
16
-
17
-
18
-
19
-
20
-
21
-
22
-
23
-
24
-
25
-
26
-
27
-
28
-
29
-
30
-
31
-
32
-
33
-
34
-
35
-
36
-
37
-
38
-
39
-
40
-
41
-
42
-
43
-
44
-
45
-
46
-
 47
47 -
 48
48 -
 49
49 -
 50
50 -
 51
51 -
 52
52 -
 53
53 -
 54
54 -
 55
55 -
 56
56 -
 57
57 -
 58
58 -
 59
59 -
 60
60 -
 61
61 -
 62
62 -
 63
63 -
 64
64 -
 65
65 -
 66
66 -
 67
67 -
68
-
69
-
70
-
71
-
72
-
73
-
74
-
75
-
76
-
77
-
78
-
79
-
80
-
81
-
82
-
83
-
84
-
85
-
86
-
87
-
88
-
89
-
90
-
91
-
92
-
93
-
94
-
95
-
96
-
97
-
98
-
99
-
100
-
101
-
102
-
103
-
104
-
105
-
106
-
107
-
108
-
109
-
110
-
111
-
112
-
113
-
114
-
115
-
116
-
117
-
118
-
119
-
120
-
121
-
122
-
123
-
124
-
125
-
126
-
127
-
128
-
129
-
130
-
131
-
132
-
133
-
134
-
135
-
136
-
137
-
138
-
139
-
140
-
141
-
142
-
143
-
144
-
145
-
146
-
147
-
148
-
149
-
150
-
151
-
152
-
153
-
154
-
155
-
156
-
157
-
158
-
159
-
160
-
161
-
162
-
163
-
164
-
165
-
166
-
167
-
168
-
169
-
170
-
171
-
172
-
173
-
174
-
175
-
176
-
177
-
178
-
179
-
180
-
181
-
182
-
183
-
184
-
185
-
186
-
187
-
188
-
189
-
190
-
191
-
192
-
193
-
194
-
195
-
196
-
197
-
198
-
199
-
200
-
201
-
202
-
203
-
204
-
205
-
206
-
207
-
208
-
209
-
210
-
211
-
212
-
213
-
214
-
215
-
216
-
217
-
218
-
219
-
220
-
221
-
222
-
223
-
224
-
225
-
226
-
227
-
228
 |
 |

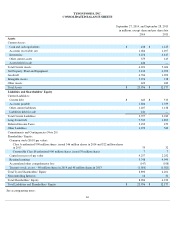
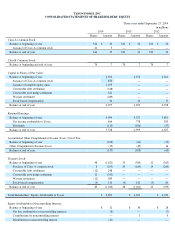
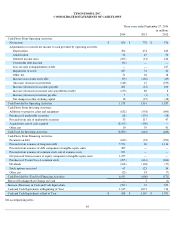
NOTES TO CONSOLIDATED FINANCIAL STATEMENTS
TYSON FOODS, INC.
NOTE 1: BUSINESS AND SUMMARY OF SIGNIFICANT ACCOUNTING POLICIES
Description of Business: Tyson Foods, Inc. (collectively, “Company,” “we,” “us” or “our”), founded in 1935 with world headquarters in
Springdale, Arkansas, is one of the world's largest producers of chicken, beef, pork and prepared foods that include leading brands such as
Tyson®, Jimmy Dean®, Hillshire Farm®, Sara Lee® frozen bakery, Ball Park®, Wright®, Aidells® and State Fair®.
Consolidation: The consolidated financial statements include the accounts of all wholly-owned subsidiaries, as well as majority-owned
subsidiaries over which we exercise control and, when applicable, entities for which we have a controlling financial interest or variable interest
entities for which we are the primary beneficiary. All significant intercompany accounts and transactions have been eliminated in
consolidation.
Fiscal Year: We utilize a 52- or 53-week accounting period ending on the Saturday closest to September 30. The Company’s accounting cycle
resulted in a 52-week year for fiscal 2014 , 2013 and 2012 .
Cash and Cash Equivalents: Cash equivalents consist of investments in short-term, highly liquid securities having original maturities of three
months or less, which are made as part of our cash management activity. The carrying values of these assets approximate their fair values. We
primarily utilize a cash management system with a series of separate accounts consisting of lockbox accounts for receiving cash, concentration
accounts where funds are moved to, and several zero-balance disbursement accounts for funding payroll, accounts payable, livestock
procurement, grower payments, etc. As a result of our cash management system, checks issued, but not presented to the banks for payment,
may result in negative book cash balances. These negative book cash balances are included in accounts payable and other current liabilities. At
September 27, 2014 , and September 28, 2013 , checks outstanding in excess of related book cash balances totaled approximately $298 million
and $246 million , respectively.
Accounts Receivable: We record accounts receivable at net realizable value. This value includes an appropriate allowance for estimated
uncollectible accounts to reflect any loss anticipated on the accounts receivable balances and charged to the provision for doubtful accounts.
We calculate this allowance based on our history of write-offs, level of past due accounts and relationships with and economic status of our
customers. At September 27, 2014 , and September 28, 2013 , our allowance for uncollectible accounts was $34 million and $46 million ,
respectively. We generally do not have collateral for our receivables, but we do periodically evaluate the credit worthiness of our customers.
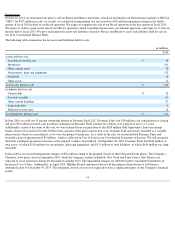
Inventories: Processed products, livestock and supplies and other are valued at the lower of cost or market. Cost includes purchased raw
materials, live purchase costs, growout costs (primarily feed, grower pay and catch and haul costs), labor and manufacturing and production
overhead, which are related to the purchase and production of inventories.
In fiscal 2014, 66% of the cost of inventories was determined by the first-in, first-out ("FIFO") method as compared to 58% in 2013. The
remaining cost of inventories for both years is determined by the weighted-average method.
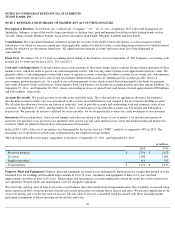
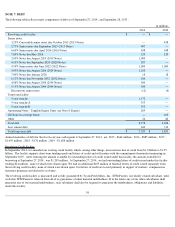
The following table reflects the major components of inventory at September 27, 2014 , and September 28, 2013 :
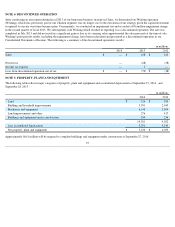
Property, Plant and Equipment: Property, plant and equipment are stated at cost and generally depreciated on a straight-
line method over the
estimated lives for buildings and leasehold improvements of 10 to 33 years , machinery and equipment of three to 12 years and land
improvements and other of three to 20 years . Major repairs and maintenance costs that significantly extend the useful life of the related assets
are capitalized. Normal repairs and maintenance costs are charged to operations.
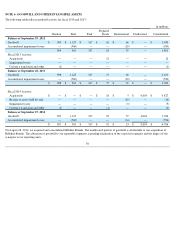
We review the carrying value of long-
lived assets at each balance sheet date if indication of impairment exists. Recoverability is assessed using
undiscounted cash flows based on historical results and current projections of earnings before interest and taxes. We measure impairment as the
excess of carrying cost over the fair value of an asset. The fair value of an asset is measured using discounted cash flows including market
participant assumptions of future operating results and discount rates.
49
in millions
2014
2013
Processed products
$
1,794
$
1,423
Livestock
1,066
1,002
Supplies and other
414
392
Total inventory
$
3,274
$
2,817