Tyson Foods 2014 Annual Report Download - page 62
Download and view the complete annual report
Please find page 62 of the 2014 Tyson Foods annual report below. You can navigate through the pages in the report by either clicking on the pages listed below, or by using the keyword search tool below to find specific information within the annual report.-
 1
1 -
2
-
3
-
4
-
5
-
6
-
7
-
8
-
9
-
10
-
11
-
12
-
13
-
14
-
15
-
16
-
17
-
18
-
19
-
20
-
21
-
22
-
23
-
24
-
25
-
26
-
27
-
28
-
29
-
30
-
31
-
32
-
33
-
34
-
35
-
36
-
37
-
38
-
39
-
40
-
41
-
42
-
43
-
44
-
45
-
46
-
47
-
48
-
49
-
50
-
51
-
 52
52 -
 53
53 -
 54
54 -
 55
55 -
 56
56 -
 57
57 -
 58
58 -
 59
59 -
 60
60 -
 61
61 -
 62
62 -
 63
63 -
 64
64 -
 65
65 -
 66
66 -
 67
67 -
 68
68 -
 69
69 -
 70
70 -
 71
71 -
 72
72 -
73
-
74
-
75
-
76
-
77
-
78
-
79
-
80
-
81
-
82
-
83
-
84
-
85
-
86
-
87
-
88
-
89
-
90
-
91
-
92
-
93
-
94
-
95
-
96
-
97
-
98
-
99
-
100
-
101
-
102
-
103
-
104
-
105
-
106
-
107
-
108
-
109
-
110
-
111
-
112
-
113
-
114
-
115
-
116
-
117
-
118
-
119
-
120
-
121
-
122
-
123
-
124
-
125
-
126
-
127
-
128
-
129
-
130
-
131
-
132
-
133
-
134
-
135
-
136
-
137
-
138
-
139
-
140
-
141
-
142
-
143
-
144
-
145
-
146
-
147
-
148
-
149
-
150
-
151
-
152
-
153
-
154
-
155
-
156
-
157
-
158
-
159
-
160
-
161
-
162
-
163
-
164
-
165
-
166
-
167
-
168
-
169
-
170
-
171
-
172
-
173
-
174
-
175
-
176
-
177
-
178
-
179
-
180
-
181
-
182
-
183
-
184
-
185
-
186
-
187
-
188
-
189
-
190
-
191
-
192
-
193
-
194
-
195
-
196
-
197
-
198
-
199
-
200
-
201
-
202
-
203
-
204
-
205
-
206
-
207
-
208
-
209
-
210
-
211
-
212
-
213
-
214
-
215
-
216
-
217
-
218
-
219
-
220
-
221
-
222
-
223
-
224
-
225
-
226
-
227
-
228
 |
 |
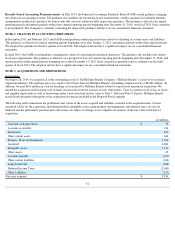
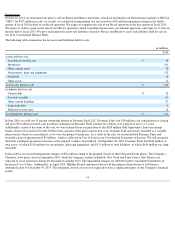
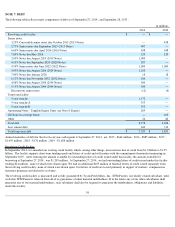
Dispositions
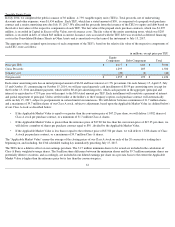
On July 28, 2014, we announced our plan to sell our Brazil and Mexico operations, which are included in our International segment, to JBS SA
("JBS") for $575 million in cash. As a result, we conducted an impairment test and recorded a $39 million impairment charge in the fourth
quarter of fiscal 2014 related to our Brazil operation. We expect to complete the sale of our Brazil operation in the first quarter of fiscal 2015.
We expect to realize a gain on the sale of our Mexico operation, which is pending the necessary government approvals, and expect it to close in
the first half of fiscal 2015. We have reclassified the assets and liabilities related to Mexico and Brazil to assets and liabilities held for sale in
our 2014 Consolidated Balance Sheet.
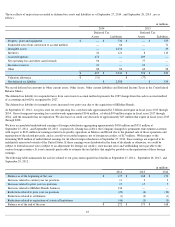
The following table summarizes the net assets and liabilities held for sale:
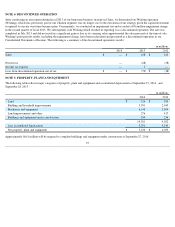
In June 2014, we sold our 50 percent ownership interest of Dynamic Fuels LLC (Dynamic Fuels) for $30 million cash consideration at closing
and up to $35 million in future cash payments contingent on Dynamic Fuels' production volumes over a period of up to 11.5 years.
Additionally as part of the terms of the sale, we were released from our guarantee of the $100 million Gulf Opportunity Zone tax-exempt
bonds, which were issued in October 2008 to fund a portion of the plant construction costs. Dynamic Fuels previously qualified as a variable
interest entity which we consolidated, as we were the primary beneficiary. As a result of the sale, we deconsolidated Dynamic Fuels and
recorded a gain of approximately $3 million , which is reflected in Cost of Sales in our Consolidated Statements of Income. We will recognize
the future contingent payments in income as the required volumes are produced. At September 28, 2013, Dynamic Fuels had $166 million of
total assets, of which $142 million was net property, plant and equipment, and $113 million of total liabilities, of which $100 million was long-
term debt.
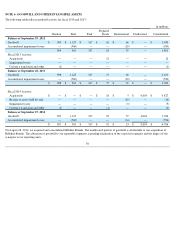
In fiscal 2014, we recorded impairment charges of $52 million related to the planned closure of three Prepared Foods plants. The Company’s
Cherokee, Iowa plant closed in September 2014, while the Company’s plants in Buffalo, New York and Santa Teresa, New Mexico are
expected to cease operations during the first half of calendar 2015. The impairment charges are reflected in the Consolidated Statements of
Income in Cost of Sales. Additionally, in April 2014, Hillshire Brands announced that it will discontinue all production at its Florence,
Alabama facility by December 30, 2014. The remaining closure costs are not expected to have a significant impact on the Company's financial
results.
54
in millions
2014
Assets held for sale:
Accounts receivable, net
$
74
Inventories
141
Other current assets
72
Net property, plant and equipment
132
Goodwill
16
Other assets
11
Total assets held for sale
$
446
Liabilities held for sale:
Current debt
$
32
Accounts payable
61
Other current liabilities
27
Long-term debt
9
Deferred income taxes
12
Total liabilities held for sale
$
141