Tyson Foods 2014 Annual Report Download - page 81
Download and view the complete annual report
Please find page 81 of the 2014 Tyson Foods annual report below. You can navigate through the pages in the report by either clicking on the pages listed below, or by using the keyword search tool below to find specific information within the annual report.-
 1
1 -
2
-
3
-
4
-
5
-
6
-
7
-
8
-
9
-
10
-
11
-
12
-
13
-
14
-
15
-
16
-
17
-
18
-
19
-
20
-
21
-
22
-
23
-
24
-
25
-
26
-
27
-
28
-
29
-
30
-
31
-
32
-
33
-
34
-
35
-
36
-
37
-
38
-
39
-
40
-
41
-
42
-
43
-
44
-
45
-
46
-
47
-
48
-
49
-
50
-
51
-
52
-
53
-
54
-
55
-
56
-
57
-
58
-
59
-
60
-
61
-
62
-
63
-
64
-
65
-
66
-
67
-
68
-
69
-
70
-
 71
71 -
 72
72 -
 73
73 -
 74
74 -
 75
75 -
 76
76 -
 77
77 -
 78
78 -
 79
79 -
 80
80 -
 81
81 -
 82
82 -
 83
83 -
 84
84 -
 85
85 -
 86
86 -
 87
87 -
 88
88 -
 89
89 -
 90
90 -
 91
91 -
92
-
93
-
94
-
95
-
96
-
97
-
98
-
99
-
100
-
101
-
102
-
103
-
104
-
105
-
106
-
107
-
108
-
109
-
110
-
111
-
112
-
113
-
114
-
115
-
116
-
117
-
118
-
119
-
120
-
121
-
122
-
123
-
124
-
125
-
126
-
127
-
128
-
129
-
130
-
131
-
132
-
133
-
134
-
135
-
136
-
137
-
138
-
139
-
140
-
141
-
142
-
143
-
144
-
145
-
146
-
147
-
148
-
149
-
150
-
151
-
152
-
153
-
154
-
155
-
156
-
157
-
158
-
159
-
160
-
161
-
162
-
163
-
164
-
165
-
166
-
167
-
168
-
169
-
170
-
171
-
172
-
173
-
174
-
175
-
176
-
177
-
178
-
179
-
180
-
181
-
182
-
183
-
184
-
185
-
186
-
187
-
188
-
189
-
190
-
191
-
192
-
193
-
194
-
195
-
196
-
197
-
198
-
199
-
200
-
201
-
202
-
203
-
204
-
205
-
206
-
207
-
208
-
209
-
210
-
211
-
212
-
213
-
214
-
215
-
216
-
217
-
218
-
219
-
220
-
221
-
222
-
223
-
224
-
225
-
226
-
227
-
228
 |
 |
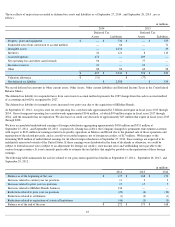
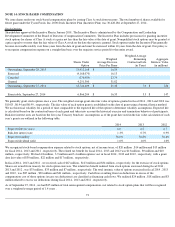
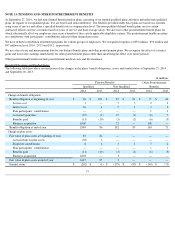
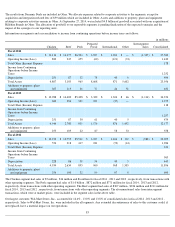
NOTE 14: STOCK-BASED COMPENSATION
We issue shares under our stock-based compensation plans by issuing Class A stock from treasury. The total number of shares available for
future grant under the Tyson Foods, Inc. 2000 Stock Incentive Plan (Incentive Plan) was 30,428,186 at September 27, 2014 .
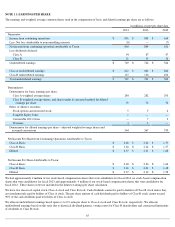
Stock Options
Shareholders approved the Incentive Plan in January 2001. The Incentive Plan is administered by the Compensation and Leadership
Development Committee of the Board of Directors (Compensation Committee). The Incentive Plan includes provisions for granting incentive
stock options for shares of Class A stock at a price not less
than the fair value at the date of grant. Nonqualified stock options may be granted at
a price equal to or more than the fair value of Class A stock on the date the option is granted. Stock options under the Incentive Plan generally
become exercisable ratably over three years from the date of grant and must be exercised within 10 years from the date of grant. Our policy is
to recognize compensation expense on a straight-line basis over the requisite service period for the entire award.
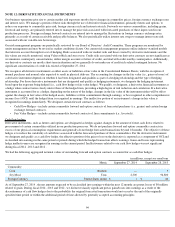
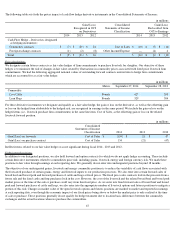
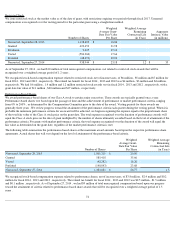
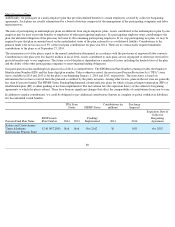
We generally grant stock options once a year. The weighted average grant-date fair value of options granted in fiscal 2014 , 2013 and 2012
was
$10.83 , $6.44 and $6.99 , respectively. The fair value of each option grant is established on the date of grant using a binomial lattice method.
We use historical volatility for a period of time comparable to the expected life of the option to determine volatility assumptions. Expected life
is calculated based on the contractual term of each grant and takes into account the historical exercise and termination behavior of participants.
Risk-free interest rates are based on the five-
year Treasury bond rate. Assumptions as of the grant date used in the fair value calculation of each
year
’s grants are outlined in the following table.
We recognized stock-based compensation expense related to stock options, net of income taxes, of $20 million , $14 million and $15 million
for fiscal 2014 , 2013 and 2012 , respectively. The related tax benefit for fiscal 2014 , 2013 and 2012 was $13 million , $9 million and $10
million , respectively. We had 4.8 million , 3.9 million and 3.4 million options vest in fiscal 2014 , 2013 and 2012 , respectively, with a grant
date fair value of $30 million , $22 million and $17 million , respectively.
In fiscal 2014 , 2013 and 2012 , we received cash of $67 million , $123 million and $34 million , respectively, for the exercise of stock options.
Shares are issued from treasury for stock option exercises. The related tax benefit realized from stock options exercised during fiscal 2014 ,
2013 and 2012 , was $33 million , $35 million and $7 million , respectively. The total intrinsic value of options exercised in fiscal 2014 , 2013
and 2012 , was $87 million , $90 million and $21 million , respectively. Cash flows resulting from tax deductions in excess of the
compensation cost of those options (excess tax deductions) are classified as financing cash flows. We realized $24 million , $18 million and $3
million related to excess tax deductions during fiscal 2014 , 2013 and 2012 , respectively.
As of September 27, 2014 , we had $35 million of total unrecognized compensation cost related to stock option plans that will be recognized
over a weighted average period of 1.4 years .
73
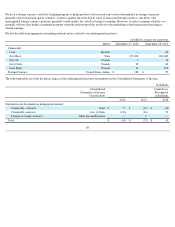
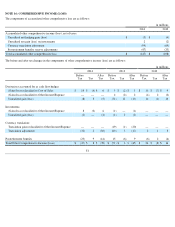
Shares Under
Option
Weighted
Average Exercise
Price Per Share
Weighted Average
Remaining
Contractual Life
(in Years)
Aggregate
Intrinsic Value
(in millions)
Outstanding, September 28, 2013
13,912,168
$
16.59
Exercised
(4,168,070
)
16.13
Canceled
(270,989
)
23.79
Granted
4,251,300
31.82
Outstanding, September 27, 2014
13,724,409
$
21.30
7.0
$
226
Exercisable, September 27, 2014
6,866,204
$
16.35
5.3
$
147
2014
2013
2012
Expected life (in years)
6.0
6.2
6.7
Risk-free interest rate
1.3
%
0.7
%
0.9
%
Expected volatility
36.0
%
36.8
%
36.6
%
Expected dividend yield
1.0
%
1.0
%
1.0
%