Tyson Foods 2014 Annual Report Download - page 103
Download and view the complete annual report
Please find page 103 of the 2014 Tyson Foods annual report below. You can navigate through the pages in the report by either clicking on the pages listed below, or by using the keyword search tool below to find specific information within the annual report.-
 1
1 -
2
-
3
-
4
-
5
-
6
-
7
-
8
-
9
-
10
-
11
-
12
-
13
-
14
-
15
-
16
-
17
-
18
-
19
-
20
-
21
-
22
-
23
-
24
-
25
-
26
-
27
-
28
-
29
-
30
-
31
-
32
-
33
-
34
-
35
-
36
-
37
-
38
-
39
-
40
-
41
-
42
-
43
-
44
-
45
-
46
-
47
-
48
-
49
-
50
-
51
-
52
-
53
-
54
-
55
-
56
-
57
-
58
-
59
-
60
-
61
-
62
-
63
-
64
-
65
-
66
-
67
-
68
-
69
-
70
-
71
-
72
-
73
-
74
-
75
-
76
-
77
-
78
-
79
-
80
-
81
-
82
-
83
-
84
-
85
-
86
-
87
-
88
-
89
-
90
-
91
-
92
-
 93
93 -
 94
94 -
 95
95 -
 96
96 -
 97
97 -
 98
98 -
 99
99 -
 100
100 -
 101
101 -
 102
102 -
 103
103 -
 104
104 -
 105
105 -
 106
106 -
 107
107 -
 108
108 -
 109
109 -
 110
110 -
 111
111 -
 112
112 -
 113
113 -
114
-
115
-
116
-
117
-
118
-
119
-
120
-
121
-
122
-
123
-
124
-
125
-
126
-
127
-
128
-
129
-
130
-
131
-
132
-
133
-
134
-
135
-
136
-
137
-
138
-
139
-
140
-
141
-
142
-
143
-
144
-
145
-
146
-
147
-
148
-
149
-
150
-
151
-
152
-
153
-
154
-
155
-
156
-
157
-
158
-
159
-
160
-
161
-
162
-
163
-
164
-
165
-
166
-
167
-
168
-
169
-
170
-
171
-
172
-
173
-
174
-
175
-
176
-
177
-
178
-
179
-
180
-
181
-
182
-
183
-
184
-
185
-
186
-
187
-
188
-
189
-
190
-
191
-
192
-
193
-
194
-
195
-
196
-
197
-
198
-
199
-
200
-
201
-
202
-
203
-
204
-
205
-
206
-
207
-
208
-
209
-
210
-
211
-
212
-
213
-
214
-
215
-
216
-
217
-
218
-
219
-
220
-
221
-
222
-
223
-
224
-
225
-
226
-
227
-
228
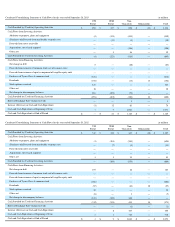
 |
 |
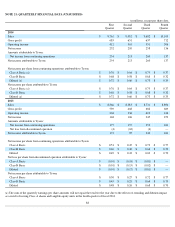
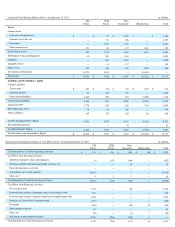
Condensed Consolidating Statement of Cash Flows for the year ended September 28, 2013
in millions
TFI
Parent
TFM
Parent
Non-
Guarantors
Eliminations
Total
Cash Provided by (Used for) Operating Activities
$
294
$
337
$
696
$
(13
)
$
1,314
Cash Flows from Investing Activities:
Additions to property, plant and equipment
(4
)
(113
)
(441
)
—
(
558
)
(Purchases of)/Proceeds from marketable securities, net —
(
13
)
(5
)
—
(
18
)
Proceeds from notes receivable —
—
—
—
—
Acquisitions, net of cash acquired —
—
(
106
)
—
(
106
)
Other, net —
3
36
—
39
Cash Provided by (Used for) Investing Activities
(4
)
(123
)
(516
)
—
(
643
)
Cash Flows from Financing Activities:
Net change in debt
5
—
(
28
)
—
(
23
)
Proceeds from issuance of common stock, net of issuance costs —
—
—
—
—
Proceeds from issuance of equity component of tangible equity units —
—
—
—
—
Purchases of Tyson Class A common stock
(614
)
—
—
—
(
614
)
Dividends
(104
)
—
(
13
)
13
(104
)
Stock options exercised
123
—
—
—
123
Other, net
18
—
—
—
18
Net change in intercompany balances
281
(202
)
(79
)
—
—
Cash Provided by (Used for) Financing Activities
(291
)
(202
)
(120
)
13
(600
)
Effect of Exchange Rate Change on Cash —
—
3
—
3
Increase (Decrease) in Cash and Cash Equivalents
(1
)
12
63
—
74
Cash and Cash Equivalents at Beginning of Year
1
9
1,061
—
1,071
Cash and Cash Equivalents at End of Period
$
—
$
21
$
1,124
$
—
$
1,145
Condensed Consolidating Statement of Cash Flows for the year ended September 29, 2012
in millions
TFI
Parent
TFM
Parent
Non-
Guarantors
Eliminations
Total
Cash Provided by (Used for) Operating Activities
$
312
$
438
$
447
$
(10
)
$
1,187
Cash Flows from Investing Activities:
Additions to property, plant and equipment
(1
)
(104
)
(585
)
—
(
690
)
(Purchases of)/Proceeds from marketable securities, net —
(
7
)
(4
)
—
(
11
)
Proceeds from notes receivable —
—
—
—
—
Acquisitions, net of cash acquired —
—
—
—
—
Other, net
1
5
35
—
41
Cash Provided by (Used for) Investing Activities —
(
106
)
(554
)
—
(
660
)
Cash Flows from Financing Activities:
Net change in debt
107
—
16
—
123
Proceeds from issuance of common stock, net of issuance costs —
—
—
—
—
Proceeds from issuance of equity component of tangible equity units —
—
—
—
—
Purchases of Tyson Class A common stock
(264
)
—
—
—
(
264
)
Dividends
(57
)
—
(
10
)
10
(57
)
Stock options exercised
34
—
—
—
34
Other, net
(8
)
—
1
—
(
7
)
Net change in intercompany balances
(124
)
(324
)
448
—
—
Cash Provided by (Used for) Financing Activities
(312
)
(324
)
455
10
(171
)
Effect of Exchange Rate Change on Cash —
—
(
1
)
—
(
1
)
Increase (Decrease) in Cash and Cash Equivalents —
8
347
—
355
Cash and Cash Equivalents at Beginning of Year
1
1
714
—
716
Cash and Cash Equivalents at End of Period
$
1
$
9
$
1,061
$
—
$
1,071