Tyson Foods 2014 Annual Report Download - page 77
Download and view the complete annual report
Please find page 77 of the 2014 Tyson Foods annual report below. You can navigate through the pages in the report by either clicking on the pages listed below, or by using the keyword search tool below to find specific information within the annual report.-
 1
1 -
2
-
3
-
4
-
5
-
6
-
7
-
8
-
9
-
10
-
11
-
12
-
13
-
14
-
15
-
16
-
17
-
18
-
19
-
20
-
21
-
22
-
23
-
24
-
25
-
26
-
27
-
28
-
29
-
30
-
31
-
32
-
33
-
34
-
35
-
36
-
37
-
38
-
39
-
40
-
41
-
42
-
43
-
44
-
45
-
46
-
47
-
48
-
49
-
50
-
51
-
52
-
53
-
54
-
55
-
56
-
57
-
58
-
59
-
60
-
61
-
62
-
63
-
64
-
65
-
66
-
 67
67 -
 68
68 -
 69
69 -
 70
70 -
 71
71 -
 72
72 -
 73
73 -
 74
74 -
 75
75 -
 76
76 -
 77
77 -
 78
78 -
 79
79 -
 80
80 -
 81
81 -
 82
82 -
 83
83 -
 84
84 -
 85
85 -
 86
86 -
 87
87 -
88
-
89
-
90
-
91
-
92
-
93
-
94
-
95
-
96
-
97
-
98
-
99
-
100
-
101
-
102
-
103
-
104
-
105
-
106
-
107
-
108
-
109
-
110
-
111
-
112
-
113
-
114
-
115
-
116
-
117
-
118
-
119
-
120
-
121
-
122
-
123
-
124
-
125
-
126
-
127
-
128
-
129
-
130
-
131
-
132
-
133
-
134
-
135
-
136
-
137
-
138
-
139
-
140
-
141
-
142
-
143
-
144
-
145
-
146
-
147
-
148
-
149
-
150
-
151
-
152
-
153
-
154
-
155
-
156
-
157
-
158
-
159
-
160
-
161
-
162
-
163
-
164
-
165
-
166
-
167
-
168
-
169
-
170
-
171
-
172
-
173
-
174
-
175
-
176
-
177
-
178
-
179
-
180
-
181
-
182
-
183
-
184
-
185
-
186
-
187
-
188
-
189
-
190
-
191
-
192
-
193
-
194
-
195
-
196
-
197
-
198
-
199
-
200
-
201
-
202
-
203
-
204
-
205
-
206
-
207
-
208
-
209
-
210
-
211
-
212
-
213
-
214
-
215
-
216
-
217
-
218
-
219
-
220
-
221
-
222
-
223
-
224
-
225
-
226
-
227
-
228
 |
 |
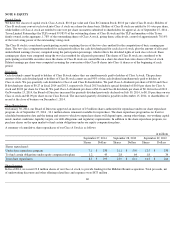
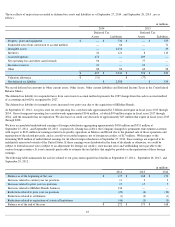
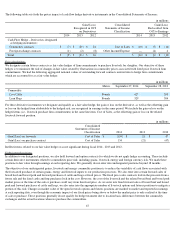
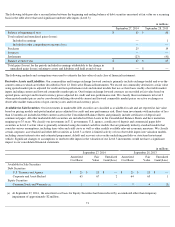
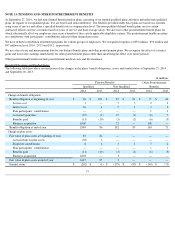
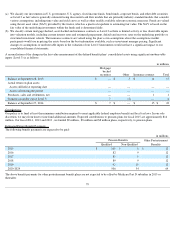
The following table sets forth the fair value of all derivative instruments outstanding in the Consolidated Balance Sheets:
Our derivative assets and liabilities are presented in our Consolidated Balance Sheets on a net basis. We net derivative assets and liabilities,
including cash collateral when a legally enforceable master netting arrangement exists between the counterparty to a derivative contract and us.
See Note 13: Fair Value Measurements for a reconciliation to amounts reported in the Consolidated Balance Sheets in Other current assets and
Other current liabilities.
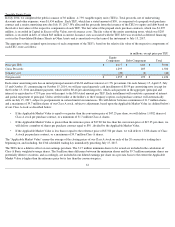
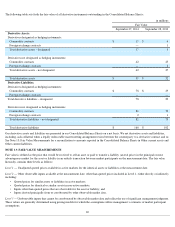
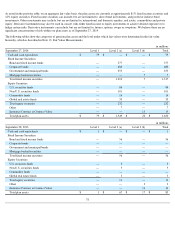
NOTE 13: FAIR VALUE MEASUREMENTS
Fair value is defined as the price that would be received to sell an asset or paid to transfer a liability (an exit price) in the principal or most
advantageous market for the asset or liability in an orderly transaction between market participants on the measurement date. The fair value
hierarchy contains three levels as follows:
Level 1
— Unadjusted quoted prices available in active markets for the identical assets or liabilities at the measurement date.
Level 2
—
Other observable inputs available at the measurement date, other than quoted prices included in Level 1, either directly or indirectly,
including:
Level 3
— Unobservable inputs that cannot be corroborated by observable market data and reflect the use of significant management judgment.
These values are generally determined using pricing models for which the assumptions utilize management’s estimates of market participant
assumptions.
69
in millions
Fair Value
September 27, 2014
September 28, 2013
Derivative Assets:
Derivatives designated as hedging instruments:
Commodity contracts
$
17
$
4
Foreign exchange contracts
—
1
Total derivative assets – designated
17
5
Derivatives not designated as hedging instruments:
Commodity contracts
42
25
Foreign exchange contracts
—
2
Total derivative assets – not designated
42
27
Total derivative assets
$
59
$
32
Derivative Liabilities:
Derivatives designated as hedging instruments:
Commodity contracts
$
78
$
29
Foreign exchange contracts
—
—
Total derivative liabilities – designated
78
29
Derivatives not designated as hedging instruments:
Commodity contracts
80
72
Foreign exchange contracts
2
1
Total derivative liabilities – not designated
82
73
Total derivative liabilities
$
160
$
102
•
Quoted prices for similar assets or liabilities in active markets;
• Quoted prices for identical or similar assets in non-
active markets;
•
Inputs other than quoted prices that are observable for the asset or liability; and
•
Inputs derived principally from or corroborated by other observable market data.