Tyson Foods 2014 Annual Report Download - page 32
Download and view the complete annual report
Please find page 32 of the 2014 Tyson Foods annual report below. You can navigate through the pages in the report by either clicking on the pages listed below, or by using the keyword search tool below to find specific information within the annual report.-
 1
1 -
2
-
3
-
4
-
5
-
6
-
7
-
8
-
9
-
10
-
11
-
12
-
13
-
14
-
15
-
16
-
17
-
18
-
19
-
20
-
21
-
 22
22 -
 23
23 -
 24
24 -
 25
25 -
 26
26 -
 27
27 -
 28
28 -
 29
29 -
 30
30 -
 31
31 -
 32
32 -
 33
33 -
 34
34 -
 35
35 -
 36
36 -
 37
37 -
 38
38 -
 39
39 -
 40
40 -
 41
41 -
 42
42 -
43
-
44
-
45
-
46
-
47
-
48
-
49
-
50
-
51
-
52
-
53
-
54
-
55
-
56
-
57
-
58
-
59
-
60
-
61
-
62
-
63
-
64
-
65
-
66
-
67
-
68
-
69
-
70
-
71
-
72
-
73
-
74
-
75
-
76
-
77
-
78
-
79
-
80
-
81
-
82
-
83
-
84
-
85
-
86
-
87
-
88
-
89
-
90
-
91
-
92
-
93
-
94
-
95
-
96
-
97
-
98
-
99
-
100
-
101
-
102
-
103
-
104
-
105
-
106
-
107
-
108
-
109
-
110
-
111
-
112
-
113
-
114
-
115
-
116
-
117
-
118
-
119
-
120
-
121
-
122
-
123
-
124
-
125
-
126
-
127
-
128
-
129
-
130
-
131
-
132
-
133
-
134
-
135
-
136
-
137
-
138
-
139
-
140
-
141
-
142
-
143
-
144
-
145
-
146
-
147
-
148
-
149
-
150
-
151
-
152
-
153
-
154
-
155
-
156
-
157
-
158
-
159
-
160
-
161
-
162
-
163
-
164
-
165
-
166
-
167
-
168
-
169
-
170
-
171
-
172
-
173
-
174
-
175
-
176
-
177
-
178
-
179
-
180
-
181
-
182
-
183
-
184
-
185
-
186
-
187
-
188
-
189
-
190
-
191
-
192
-
193
-
194
-
195
-
196
-
197
-
198
-
199
-
200
-
201
-
202
-
203
-
204
-
205
-
206
-
207
-
208
-
209
-
210
-
211
-
212
-
213
-
214
-
215
-
216
-
217
-
218
-
219
-
220
-
221
-
222
-
223
-
224
-
225
-
226
-
227
-
228
 |
 |

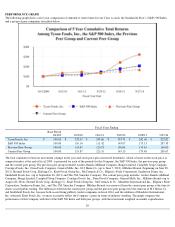
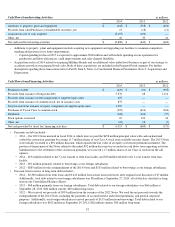
2014 vs. 2013 –
2013 vs. 2012 –
2014 vs. 2013 –
2013 vs. 2012 –
28
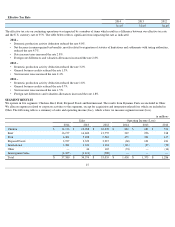
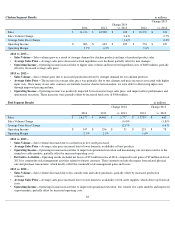
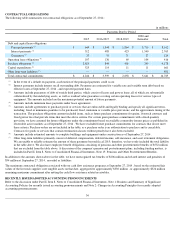
Chicken Segment Results
in millions
2014
2013
Change 2014
vs. 2013
2012
Change 2013
vs. 2012
Sales
$
11,116
$
10,988
$
128
$
10,270
$
718
Sales Volume Change
2.6
%
0.7
%
Average Sales Price Change
(1.4
)%
6.2
%
Operating Income
$
883
$
683
$
200
$
554
$
129
Operating Margin
7.9
%
6.2
%
5.4
%
• Sales Volume –
Sales volume grew as a result of stronger demand for chicken products and mix of rendered product sales.
• Average Sales Price –
Average sales price decreased as feed ingredient costs declined, partially offset by mix changes.
• Operating Income – Operating income increased due to higher sales volume and lower feed ingredient costs of $600 million, partially
offset by decreased average sales price.
• Sales Volume –
Sales volume grew due to increased production driven by stronger demand for our chicken products.
• Average Sales Price – The increase in average sales price was primarily due to mix changes and price increases associated with higher
input costs. Since many of our sales contracts are formula based or shorter-term in nature, we were able to offset rising input costs
through improved pricing and mix.
• Operating Income – Operating income was positively impacted by increased average sales price, and improved live performance and
operational execution. These increases were partially offset by increased feed costs of $406 million.
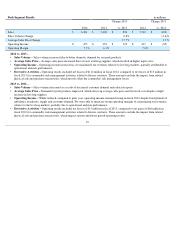
Beef Segment Results
in millions
2014
2013
Change 2014
vs. 2013
2012
Change 2013
vs. 2012
Sales
$
16,177
$
14,400
$
1,777
$
13,755
$
645
Sales Volume Change
(0.4
)%
(1.8
)%
Average Sales Price Change
12.8
%
6.6
%
Operating Income
$
347
$
296
$
51
$
218
$
78
Operating Margin
2.1
%
2.1
%
1.6
%
• Sales Volume –
Sales volume decreased due to a reduction in live cattle processed.
• Average Sales Price –
Average sales price increased due to lower domestic availability of beef products.
• Operating Income – Operating income increased due to improved operational execution and maximizing our revenues relative to the
rising live cattle markets, partially offset by increased operating costs.
• Derivative Activities –
Operating results included net losses of $72 million in fiscal 2014, compared to net gains of $9 million in fiscal
2013 for commodity risk management activities related to futures contracts. These amounts exclude the impact from related physical
sale and purchase transactions, which mostly offset the commodity risk management gains and losses.
• Sales Volume – Sales volume decreased due to less outside trim and tallow purchases, partially offset by increased production
volumes.
• Average Sales Price –
Average sales price increased due to lower domestic availability of fed cattle supplies, which drove up livestock
costs.
• Operating Income –
Operating income increased due to improved operational execution, less volatile live cattle markets and improved
export markets, partially offset by increased operating costs.