Tyson Foods 2014 Annual Report Download - page 54
Download and view the complete annual report
Please find page 54 of the 2014 Tyson Foods annual report below. You can navigate through the pages in the report by either clicking on the pages listed below, or by using the keyword search tool below to find specific information within the annual report.-
 1
1 -
2
-
3
-
4
-
5
-
6
-
7
-
8
-
9
-
10
-
11
-
12
-
13
-
14
-
15
-
16
-
17
-
18
-
19
-
20
-
21
-
22
-
23
-
24
-
25
-
26
-
27
-
28
-
29
-
30
-
31
-
32
-
33
-
34
-
35
-
36
-
37
-
38
-
39
-
40
-
41
-
42
-
43
-
 44
44 -
 45
45 -
 46
46 -
 47
47 -
 48
48 -
 49
49 -
 50
50 -
 51
51 -
 52
52 -
 53
53 -
 54
54 -
 55
55 -
 56
56 -
 57
57 -
 58
58 -
 59
59 -
 60
60 -
 61
61 -
 62
62 -
 63
63 -
 64
64 -
65
-
66
-
67
-
68
-
69
-
70
-
71
-
72
-
73
-
74
-
75
-
76
-
77
-
78
-
79
-
80
-
81
-
82
-
83
-
84
-
85
-
86
-
87
-
88
-
89
-
90
-
91
-
92
-
93
-
94
-
95
-
96
-
97
-
98
-
99
-
100
-
101
-
102
-
103
-
104
-
105
-
106
-
107
-
108
-
109
-
110
-
111
-
112
-
113
-
114
-
115
-
116
-
117
-
118
-
119
-
120
-
121
-
122
-
123
-
124
-
125
-
126
-
127
-
128
-
129
-
130
-
131
-
132
-
133
-
134
-
135
-
136
-
137
-
138
-
139
-
140
-
141
-
142
-
143
-
144
-
145
-
146
-
147
-
148
-
149
-
150
-
151
-
152
-
153
-
154
-
155
-
156
-
157
-
158
-
159
-
160
-
161
-
162
-
163
-
164
-
165
-
166
-
167
-
168
-
169
-
170
-
171
-
172
-
173
-
174
-
175
-
176
-
177
-
178
-
179
-
180
-
181
-
182
-
183
-
184
-
185
-
186
-
187
-
188
-
189
-
190
-
191
-
192
-
193
-
194
-
195
-
196
-
197
-
198
-
199
-
200
-
201
-
202
-
203
-
204
-
205
-
206
-
207
-
208
-
209
-
210
-
211
-
212
-
213
-
214
-
215
-
216
-
217
-
218
-
219
-
220
-
221
-
222
-
223
-
224
-
225
-
226
-
227
-
228
 |
 |
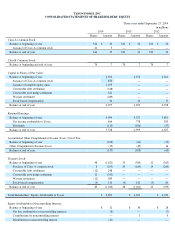
TYSON FOODS, INC.
CONSOLIDATED STATEMENTS OF SHAREHOLDERS’ EQUITY
Three years ended September 27, 2014
in millions
2014
2013
2012
Shares
Amount
Shares
Amount
Shares
Amount
Class A Common Stock:
Balance at beginning of year
322
$
32
322
$
32
322
$
32
Issuance of Class A common stock
24
3
—
—
—
—
Balance at end of year
346
35
322
32
322
32
Class B Common Stock:
Balance at beginning and end of year
70
7
70
7
70
7
Capital in Excess of Par Value:
Balance at beginning of year
2,292
2,278
2,261
Issuance of Class A common stock
870
—
—
Issuance of tangible equity units
1,255
—
—
Convertible debt settlement
(248
)
—
—
Convertible note hedge settlement
341
—
—
Warrant settlement
(289
)
—
—
Stock-based compensation
36
14
17
Balance at end of year
4,257
2,292
2,278
Retained Earnings:
Balance at beginning of year
4,999
4,327
3,801
Net income attributable to Tyson
864
778
583
Dividends
(115
)
(106
)
(57
)
Balance at end of year
5,748
4,999
4,327
Accumulated Other Comprehensive Income (Loss), Net of Tax:
Balance at beginning of year
(108
)
(63
)
(79
)
Other Comprehensive Income (Loss)
(39
)
(45
)
16
Balance at end of year
(147
)
(108
)
(63
)
Treasury Stock:
Balance at beginning of year
48
(1,021
)
33
(569
)
22
(365
)
Purchase of Class A common stock
8
(295
)
24
(614
)
14
(264
)
Convertible debt settlement
(12
)
248
—
—
—
—
Convertible note hedge settlement
12
(341
)
—
—
—
—
Warrant settlement
(12
)
289
—
—
—
—
Stock-based compensation
(4
)
110
(9
)
162
(3
)
60
Balance at end of year
40
(1,010
)
48
(1,021
)
33
(569
)
Total Shareholders’ Equity Attributable to Tyson
$
8,890
$
6,201
$
6,012
Equity Attributable to Noncontrolling Interests:
Balance at beginning of year
$
32
$
30
$
28
Net loss attributable to noncontrolling interests
(8
)
—
(
7
)
Contributions by noncontrolling interest
—
3
9
Distributions to noncontrolling interest
(11
)
—
—