Tyson Foods 2014 Annual Report Download - page 84
Download and view the complete annual report
Please find page 84 of the 2014 Tyson Foods annual report below. You can navigate through the pages in the report by either clicking on the pages listed below, or by using the keyword search tool below to find specific information within the annual report.-
 1
1 -
2
-
3
-
4
-
5
-
6
-
7
-
8
-
9
-
10
-
11
-
12
-
13
-
14
-
15
-
16
-
17
-
18
-
19
-
20
-
21
-
22
-
23
-
24
-
25
-
26
-
27
-
28
-
29
-
30
-
31
-
32
-
33
-
34
-
35
-
36
-
37
-
38
-
39
-
40
-
41
-
42
-
43
-
44
-
45
-
46
-
47
-
48
-
49
-
50
-
51
-
52
-
53
-
54
-
55
-
56
-
57
-
58
-
59
-
60
-
61
-
62
-
63
-
64
-
65
-
66
-
67
-
68
-
69
-
70
-
71
-
72
-
73
-
 74
74 -
 75
75 -
 76
76 -
 77
77 -
 78
78 -
 79
79 -
 80
80 -
 81
81 -
 82
82 -
 83
83 -
 84
84 -
 85
85 -
 86
86 -
 87
87 -
 88
88 -
 89
89 -
 90
90 -
 91
91 -
 92
92 -
 93
93 -
 94
94 -
95
-
96
-
97
-
98
-
99
-
100
-
101
-
102
-
103
-
104
-
105
-
106
-
107
-
108
-
109
-
110
-
111
-
112
-
113
-
114
-
115
-
116
-
117
-
118
-
119
-
120
-
121
-
122
-
123
-
124
-
125
-
126
-
127
-
128
-
129
-
130
-
131
-
132
-
133
-
134
-
135
-
136
-
137
-
138
-
139
-
140
-
141
-
142
-
143
-
144
-
145
-
146
-
147
-
148
-
149
-
150
-
151
-
152
-
153
-
154
-
155
-
156
-
157
-
158
-
159
-
160
-
161
-
162
-
163
-
164
-
165
-
166
-
167
-
168
-
169
-
170
-
171
-
172
-
173
-
174
-
175
-
176
-
177
-
178
-
179
-
180
-
181
-
182
-
183
-
184
-
185
-
186
-
187
-
188
-
189
-
190
-
191
-
192
-
193
-
194
-
195
-
196
-
197
-
198
-
199
-
200
-
201
-
202
-
203
-
204
-
205
-
206
-
207
-
208
-
209
-
210
-
211
-
212
-
213
-
214
-
215
-
216
-
217
-
218
-
219
-
220
-
221
-
222
-
223
-
224
-
225
-
226
-
227
-
228
 |
 |
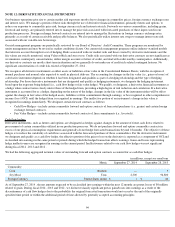
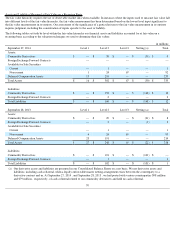
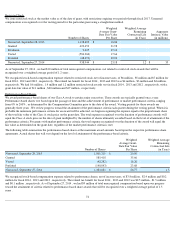
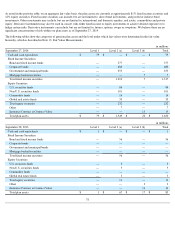
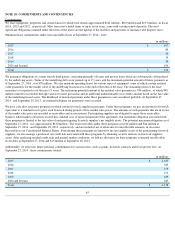
Amounts recognized in the Consolidated Balance Sheets consist of:
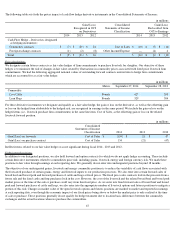
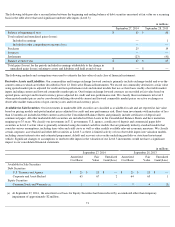
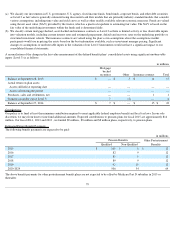
At September 27, 2014 , seven pension plans had an accumulated benefit obligation in excess of plan assets. At September 28, 2013 , three
pension plans had an accumulated benefit obligation in excess of plan assets. Plans with accumulated benefit obligations in excess of plan
assets are as follows:
The accumulated benefit obligation for all qualified pension plans was $1,849 million and $86 million at September 27, 2014 , and
September 28, 2013 , respectively.
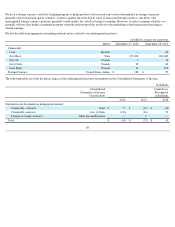
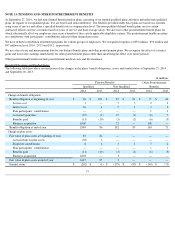
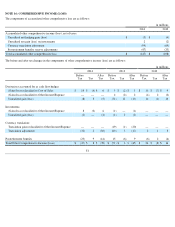
Net Periodic Benefit Cost
Components of net periodic benefit cost for pension and postretirement benefit plans recognized in the Consolidated Statements of Income are
as follows:
As of September 27, 2014 , the amounts expected to be reclassified into earnings within the next 12 months related to net periodic benefit cost
for the qualified and non-qualified pensions are $2 million and $4 million , respectively.
76
in millions
Pension Benefits
Other Postretirement
Qualified
Non-Qualified
Benefits
2014
2013
2014
2013
2014
2013
Other current liabilities
$
—
$
—
$
(
5
)
$
—
$
(
7
)
$
—
Other liabilities
(202
)
(1
)
(174
)
(85
)
(156
)
(71
)
Accumulated other comprehensive (income)/loss:
Actuarial loss
39
30
36
23
—
—
Prior service cost/(credit)
—
—
—
—
(
2
)
(3
)
Net amount recognized
$
(163
)
$
29
$
(143
)
$
(62
)
$
(165
)
$
(74
)
in millions
Pension Benefits
Qualified
Non-Qualified
2014
2013
2014
2013
Projected benefit obligation
$
1,829
$
27
$
182
$
85
Accumulated benefit obligation
1,829
27
172
72
Fair value of plan assets
1,627
26
3
—
in millions
Pension Benefits
Other Postretirement
Qualified
Non-Qualified
Benefits
2014
2013
2012
2014
2013
2012
2014
2013
2012
Service cost
$
1
$
—
$
—
$
7
$
5
$
5
$
2
$
2
$
1
Interest cost
10
4
4
5
3
3
3
2
2
Expected return on plan assets
(13
)
(5
)
(6
)
—
—
—
—
—
—
Amortization of prior service cost
—
—
—
—
1
1
—
(
1
)
(1
)
Recognized actuarial (gain) loss, net
2
4
3
2
3
1
(8
)
7
24
Net periodic benefit cost
$
—
$
3
$
1
$
14
$
12
$
10
$
(3
)
$
10
$
26