Tyson Foods 2014 Annual Report Download - page 86
Download and view the complete annual report
Please find page 86 of the 2014 Tyson Foods annual report below. You can navigate through the pages in the report by either clicking on the pages listed below, or by using the keyword search tool below to find specific information within the annual report.-
 1
1 -
2
-
3
-
4
-
5
-
6
-
7
-
8
-
9
-
10
-
11
-
12
-
13
-
14
-
15
-
16
-
17
-
18
-
19
-
20
-
21
-
22
-
23
-
24
-
25
-
26
-
27
-
28
-
29
-
30
-
31
-
32
-
33
-
34
-
35
-
36
-
37
-
38
-
39
-
40
-
41
-
42
-
43
-
44
-
45
-
46
-
47
-
48
-
49
-
50
-
51
-
52
-
53
-
54
-
55
-
56
-
57
-
58
-
59
-
60
-
61
-
62
-
63
-
64
-
65
-
66
-
67
-
68
-
69
-
70
-
71
-
72
-
73
-
74
-
75
-
 76
76 -
 77
77 -
 78
78 -
 79
79 -
 80
80 -
 81
81 -
 82
82 -
 83
83 -
 84
84 -
 85
85 -
 86
86 -
 87
87 -
 88
88 -
 89
89 -
 90
90 -
 91
91 -
 92
92 -
 93
93 -
 94
94 -
 95
95 -
 96
96 -
97
-
98
-
99
-
100
-
101
-
102
-
103
-
104
-
105
-
106
-
107
-
108
-
109
-
110
-
111
-
112
-
113
-
114
-
115
-
116
-
117
-
118
-
119
-
120
-
121
-
122
-
123
-
124
-
125
-
126
-
127
-
128
-
129
-
130
-
131
-
132
-
133
-
134
-
135
-
136
-
137
-
138
-
139
-
140
-
141
-
142
-
143
-
144
-
145
-
146
-
147
-
148
-
149
-
150
-
151
-
152
-
153
-
154
-
155
-
156
-
157
-
158
-
159
-
160
-
161
-
162
-
163
-
164
-
165
-
166
-
167
-
168
-
169
-
170
-
171
-
172
-
173
-
174
-
175
-
176
-
177
-
178
-
179
-
180
-
181
-
182
-
183
-
184
-
185
-
186
-
187
-
188
-
189
-
190
-
191
-
192
-
193
-
194
-
195
-
196
-
197
-
198
-
199
-
200
-
201
-
202
-
203
-
204
-
205
-
206
-
207
-
208
-
209
-
210
-
211
-
212
-
213
-
214
-
215
-
216
-
217
-
218
-
219
-
220
-
221
-
222
-
223
-
224
-
225
-
226
-
227
-
228
 |
 |
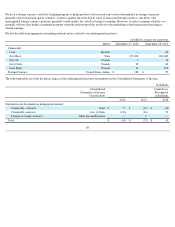
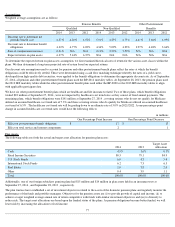
As noted in the previous table, on an aggregate fair value basis, the plan assets are currently at approximately 81% fixed income securities and
12% equity securities. Fixed income securities can include, but are not limited to, direct bond investments, and pooled or indirect bond
investments. Other investments may include, but are not limited to, international and domestic equities, real estate, commodities and private
equity. Derivative instruments may also be used in concert with either fixed income or equity investments to achieve desired exposure or to
hedge certain risks. Derivative instruments can include, but are not limited to, futures, options, swaps or swaptions. We believe there are no
significant concentrations of risk within our plan assets as of September 27, 2014 .
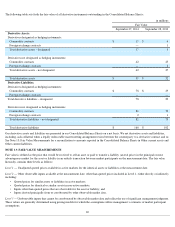
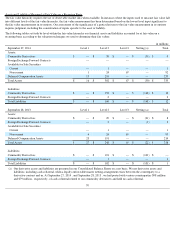
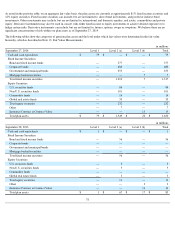
The following tables show the categories of pension plan assets and the level under which fair values were determined in the fair value
hierarchy, which is described in Note 13: Fair Value Measurements.
78
in millions
September 27, 2014
Level 1
Level 2 (a)
Level 3 (b)
Total
Cash and cash equivalents
$
79
$
—
$
—
$
79
Fixed Income Securities:
Bond and fixed income funds
—
377
—
377
Corporate bonds
—
680
—
680
Government and municipal bonds
—
253
—
253
Mortgage backed securities
—
—
7
7
Total fixed income securities
—
1,310
7
1,317
Equity Securities:
U.S. securities funds
—
84
—
84
Non-U.S. securities funds
—
101
—
101
Commodity funds
—
14
—
14
Global real estate funds
—
33
—
33
Total equity securities
—
232
—
232
Other
—
7
—
7
Insurance Contract at Contract Value
—
—
15
15
Total plan assets
$
79
$
1,549
$
22
$
1,650
in millions
September 28, 2013
Level 1
Level 2 (a)
Level 3 (b)
Total
Cash and cash equivalents
$
1
$
—
$
—
$
1
Fixed Income Securities:
Bond and fixed income funds
—
56
—
56
Corporate bonds
—
—
—
—
Government and municipal bonds
—
—
—
—
Mortgage backed securities
—
—
—
—
Total fixed income securities
—
56
—
56
Equity Securities:
U.S. securities funds
—
3
—
3
Non-U.S. securities funds
—
5
—
5
Commodity funds
—
—
—
—
Global real estate funds
—
3
—
3
Total equity securities
—
11
—
11
Other
—
—
3
3
Insurance Contract at Contract Value
—
—
14
14
Total plan assets
$
1
$
67
$
17
$
85