Tyson Foods 2014 Annual Report Download - page 33
Download and view the complete annual report
Please find page 33 of the 2014 Tyson Foods annual report below. You can navigate through the pages in the report by either clicking on the pages listed below, or by using the keyword search tool below to find specific information within the annual report.-
 1
1 -
2
-
3
-
4
-
5
-
6
-
7
-
8
-
9
-
10
-
11
-
12
-
13
-
14
-
15
-
16
-
17
-
18
-
19
-
20
-
21
-
22
-
 23
23 -
 24
24 -
 25
25 -
 26
26 -
 27
27 -
 28
28 -
 29
29 -
 30
30 -
 31
31 -
 32
32 -
 33
33 -
 34
34 -
 35
35 -
 36
36 -
 37
37 -
 38
38 -
 39
39 -
 40
40 -
 41
41 -
 42
42 -
 43
43 -
44
-
45
-
46
-
47
-
48
-
49
-
50
-
51
-
52
-
53
-
54
-
55
-
56
-
57
-
58
-
59
-
60
-
61
-
62
-
63
-
64
-
65
-
66
-
67
-
68
-
69
-
70
-
71
-
72
-
73
-
74
-
75
-
76
-
77
-
78
-
79
-
80
-
81
-
82
-
83
-
84
-
85
-
86
-
87
-
88
-
89
-
90
-
91
-
92
-
93
-
94
-
95
-
96
-
97
-
98
-
99
-
100
-
101
-
102
-
103
-
104
-
105
-
106
-
107
-
108
-
109
-
110
-
111
-
112
-
113
-
114
-
115
-
116
-
117
-
118
-
119
-
120
-
121
-
122
-
123
-
124
-
125
-
126
-
127
-
128
-
129
-
130
-
131
-
132
-
133
-
134
-
135
-
136
-
137
-
138
-
139
-
140
-
141
-
142
-
143
-
144
-
145
-
146
-
147
-
148
-
149
-
150
-
151
-
152
-
153
-
154
-
155
-
156
-
157
-
158
-
159
-
160
-
161
-
162
-
163
-
164
-
165
-
166
-
167
-
168
-
169
-
170
-
171
-
172
-
173
-
174
-
175
-
176
-
177
-
178
-
179
-
180
-
181
-
182
-
183
-
184
-
185
-
186
-
187
-
188
-
189
-
190
-
191
-
192
-
193
-
194
-
195
-
196
-
197
-
198
-
199
-
200
-
201
-
202
-
203
-
204
-
205
-
206
-
207
-
208
-
209
-
210
-
211
-
212
-
213
-
214
-
215
-
216
-
217
-
218
-
219
-
220
-
221
-
222
-
223
-
224
-
225
-
226
-
227
-
228
 |
 |

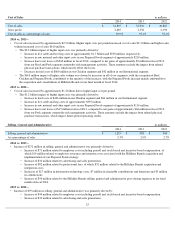
2014 vs. 2013 –
2013 vs. 2012 –
29
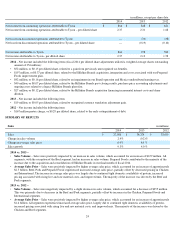
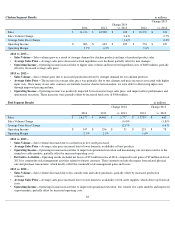
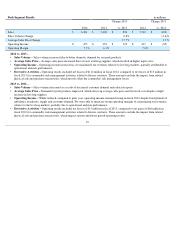
Pork Segment Results
in millions
2014
2013
Change 2014
vs. 2013
2012
Change 2013
vs. 2012
Sales
$
6,304
$
5,408
$
896
$
5,510
$
(102
)
Sales Volume Change
0.8
%
(3.6
)%
Average Sales Price Change
15.7
%
1.9
%
Operating Income
$
455
$
332
$
123
$
417
$
(85
)
Operating Margin
7.2
%
6.1
%
7.6
%
• Sales Volume –
Sales volume increased due to better domestic demand for our pork products.
• Average Sales Price –
Average sales price increased due to lower total hog supplies, which resulted in higher input costs.
• Operating Income – Operating income increased as we maximized our revenues relative to live hog markets, partially attributable to
operational and mix performance.
• Derivative Activities – Operating results included net losses of $112 million in fiscal 2014, compared to net losses of $15 million in
fiscal 2013 for commodity risk management activities related to futures contracts. These amounts exclude the impact from related
physical sale and purchase transactions, which mostly offset the commodity risk management losses.
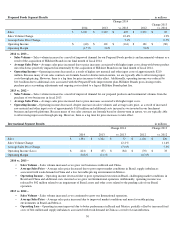
• Sales Volume –
Sales volume decreased as a result of decreased customer demand and reduced exports.
• Average Sales Price – Demand for pork products improved, which drove up average sales price and livestock cost despite a slight
increase in live hog supplies.
• Operating Income – While reduced compared to prior year, operating income remained strong in fiscal 2013 despite brief periods of
imbalance in industry supply and customer demand. We were able to maintain strong operating margins by maximizing our revenues
relative to the live hog markets, partially due to operational and mix performance.
• Derivative Activities – Operating results included net losses of $15 million in fiscal 2013, compared to net gains of $66 million in
fiscal 2012 for commodity risk management activities related to futures contracts. These amounts exclude the impact from related
physical sale and purchase transactions, which impact current and future period operating results.