Tyson Foods 2014 Annual Report Download - page 79
Download and view the complete annual report
Please find page 79 of the 2014 Tyson Foods annual report below. You can navigate through the pages in the report by either clicking on the pages listed below, or by using the keyword search tool below to find specific information within the annual report.-
 1
1 -
2
-
3
-
4
-
5
-
6
-
7
-
8
-
9
-
10
-
11
-
12
-
13
-
14
-
15
-
16
-
17
-
18
-
19
-
20
-
21
-
22
-
23
-
24
-
25
-
26
-
27
-
28
-
29
-
30
-
31
-
32
-
33
-
34
-
35
-
36
-
37
-
38
-
39
-
40
-
41
-
42
-
43
-
44
-
45
-
46
-
47
-
48
-
49
-
50
-
51
-
52
-
53
-
54
-
55
-
56
-
57
-
58
-
59
-
60
-
61
-
62
-
63
-
64
-
65
-
66
-
67
-
68
-
 69
69 -
 70
70 -
 71
71 -
 72
72 -
 73
73 -
 74
74 -
 75
75 -
 76
76 -
 77
77 -
 78
78 -
 79
79 -
 80
80 -
 81
81 -
 82
82 -
 83
83 -
 84
84 -
 85
85 -
 86
86 -
 87
87 -
 88
88 -
 89
89 -
90
-
91
-
92
-
93
-
94
-
95
-
96
-
97
-
98
-
99
-
100
-
101
-
102
-
103
-
104
-
105
-
106
-
107
-
108
-
109
-
110
-
111
-
112
-
113
-
114
-
115
-
116
-
117
-
118
-
119
-
120
-
121
-
122
-
123
-
124
-
125
-
126
-
127
-
128
-
129
-
130
-
131
-
132
-
133
-
134
-
135
-
136
-
137
-
138
-
139
-
140
-
141
-
142
-
143
-
144
-
145
-
146
-
147
-
148
-
149
-
150
-
151
-
152
-
153
-
154
-
155
-
156
-
157
-
158
-
159
-
160
-
161
-
162
-
163
-
164
-
165
-
166
-
167
-
168
-
169
-
170
-
171
-
172
-
173
-
174
-
175
-
176
-
177
-
178
-
179
-
180
-
181
-
182
-
183
-
184
-
185
-
186
-
187
-
188
-
189
-
190
-
191
-
192
-
193
-
194
-
195
-
196
-
197
-
198
-
199
-
200
-
201
-
202
-
203
-
204
-
205
-
206
-
207
-
208
-
209
-
210
-
211
-
212
-
213
-
214
-
215
-
216
-
217
-
218
-
219
-
220
-
221
-
222
-
223
-
224
-
225
-
226
-
227
-
228
 |
 |

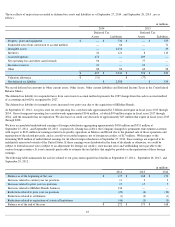
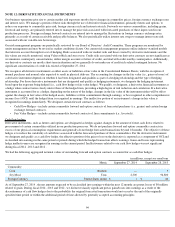
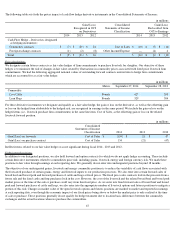
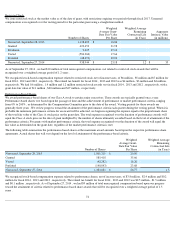
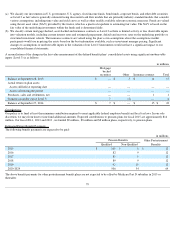
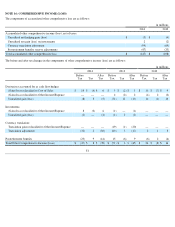
The following table provides a reconciliation between the beginning and ending balance of debt securities measured at fair value on a recurring
basis in the table above that used significant unobservable inputs (Level 3):
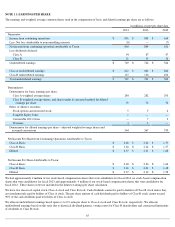
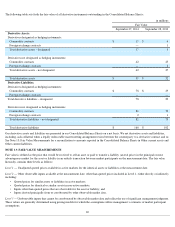
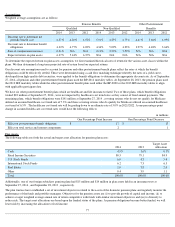
The following methods and assumptions were used to estimate the fair value of each class of financial instrument:
Derivative Assets and Liabilities: Our commodities and foreign exchange forward contracts primarily include exchange-traded and over-the-
counter contracts which are further described in Note 12: Derivative Financial Instruments. We record our commodity derivatives at fair value
using quoted market prices adjusted for credit and non-performance risk and internal models that use as their basis readily observable market
inputs including current and forward commodity market prices. Our foreign exchange forward contracts are recorded at fair value based on
quoted prices and spot and forward currency prices adjusted for credit and non-performance risk. We classify these instruments in Level 2
when quoted market prices can be corroborated utilizing observable current and forward commodity market prices on active exchanges or
observable market transactions of spot currency rates and forward currency prices.
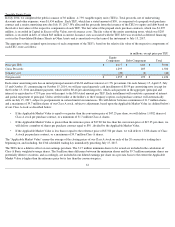
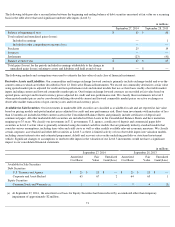
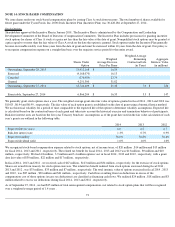
Available for Sale Securities: Our investments in marketable debt securities are classified as available-for-sale and are reported at fair value
based on pricing models and quoted market prices adjusted for credit and non-performance risk. Short-term investments with maturities of less
than 12 months are included in Other current assets in the Consolidated Balance Sheets and primarily include certificates of deposit and
commercial paper. All other marketable debt securities are included in Other Assets in the Consolidated Balance Sheets and have maturities
ranging up to 35 years. We classify our investments in U.S. government, U.S. agency, certificates of deposit and commercial paper debt
securities as Level 2 as fair value is generally estimated using discounted cash flow models that are primarily industry-standard models that
consider various assumptions, including time value and yield curve as well as other readily available relevant economic measures. We classify
certain corporate, asset-backed and other debt securities as Level 3 as there is limited activity or less observable inputs into valuation models,
including current interest rates and estimated prepayment, default and recovery rates on the underlying portfolio or structured investment
vehicle. Significant changes to assumptions or unobservable inputs in the valuation of our Level 3 instruments would not have a significant
impact to our consolidated financial statements.
71
in millions
September 27, 2014
September 28, 2013
Balance at beginning of year
$
65
$
86
Total realized and unrealized gains (losses):
Included in earnings
—
1
Included in other comprehensive income (loss)
—
—
Purchases
25
19
Issuances
—
—
Settlements
(23
)
(41
)
Balance at end of year
$
67
$
65
Total gains (losses) for the periods included in earnings attributable to the change in
unrealized gains (losses) relating to assets and liabilities still held at end of year
$
—
$
—
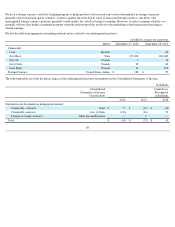
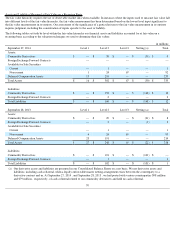
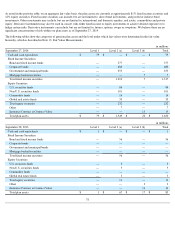
in millions
September 27, 2014
September 28, 2013
Amortized
Cost Basis
Fair
Value
Unrealized
Gain/(Loss)
Amortized
Cost Basis
Fair
Value
Unrealized
Gain/(Loss)
Available for Sale Securities:
Debt Securities:
U.S. Treasury and Agency
$
25
$
25
$
—
$
25
$
25
$
—
Corporate and Asset-Backed
65
67
2
64
65
1
Equity Securities:
Common Stock and Warrants (a)
1
1
—
9
4
(5
)
(a) At September 27, 2014 , the amortized cost basis for Equity Securities had been reduced by accumulated other than temporary
impairment of approximately $2 million .