Tyson Foods 2014 Annual Report Download - page 53
Download and view the complete annual report
Please find page 53 of the 2014 Tyson Foods annual report below. You can navigate through the pages in the report by either clicking on the pages listed below, or by using the keyword search tool below to find specific information within the annual report.-
 1
1 -
2
-
3
-
4
-
5
-
6
-
7
-
8
-
9
-
10
-
11
-
12
-
13
-
14
-
15
-
16
-
17
-
18
-
19
-
20
-
21
-
22
-
23
-
24
-
25
-
26
-
27
-
28
-
29
-
30
-
31
-
32
-
33
-
34
-
35
-
36
-
37
-
38
-
39
-
40
-
41
-
42
-
 43
43 -
 44
44 -
 45
45 -
 46
46 -
 47
47 -
 48
48 -
 49
49 -
 50
50 -
 51
51 -
 52
52 -
 53
53 -
 54
54 -
 55
55 -
 56
56 -
 57
57 -
 58
58 -
 59
59 -
 60
60 -
 61
61 -
 62
62 -
 63
63 -
64
-
65
-
66
-
67
-
68
-
69
-
70
-
71
-
72
-
73
-
74
-
75
-
76
-
77
-
78
-
79
-
80
-
81
-
82
-
83
-
84
-
85
-
86
-
87
-
88
-
89
-
90
-
91
-
92
-
93
-
94
-
95
-
96
-
97
-
98
-
99
-
100
-
101
-
102
-
103
-
104
-
105
-
106
-
107
-
108
-
109
-
110
-
111
-
112
-
113
-
114
-
115
-
116
-
117
-
118
-
119
-
120
-
121
-
122
-
123
-
124
-
125
-
126
-
127
-
128
-
129
-
130
-
131
-
132
-
133
-
134
-
135
-
136
-
137
-
138
-
139
-
140
-
141
-
142
-
143
-
144
-
145
-
146
-
147
-
148
-
149
-
150
-
151
-
152
-
153
-
154
-
155
-
156
-
157
-
158
-
159
-
160
-
161
-
162
-
163
-
164
-
165
-
166
-
167
-
168
-
169
-
170
-
171
-
172
-
173
-
174
-
175
-
176
-
177
-
178
-
179
-
180
-
181
-
182
-
183
-
184
-
185
-
186
-
187
-
188
-
189
-
190
-
191
-
192
-
193
-
194
-
195
-
196
-
197
-
198
-
199
-
200
-
201
-
202
-
203
-
204
-
205
-
206
-
207
-
208
-
209
-
210
-
211
-
212
-
213
-
214
-
215
-
216
-
217
-
218
-
219
-
220
-
221
-
222
-
223
-
224
-
225
-
226
-
227
-
228
 |
 |
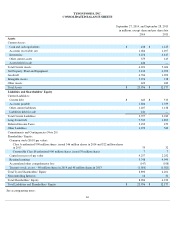
TYSON FOODS, INC.
CONSOLIDATED BALANCE SHEETS
See accompanying notes.
46
September 27, 2014, and September 28, 2013
in millions, except share and per share data
2014
2013
Assets
Current Assets:
Cash and cash equivalents
$
438
$
1,145
Accounts receivable, net
1,684
1,497
Inventories
3,274
2,817
Other current assets
379
145
Assets held for sale
446
—
Total Current Assets
6,221
5,604
Net Property, Plant and Equipment
5,130
4,053
Goodwill
6,706
1,902
Intangible Assets
5,276
138
Other Assets
623
480
Total Assets
$
23,956
$
12,177
Liabilities and Shareholders’ Equity
Current Liabilities:
Current debt
$
643
$
513
Accounts payable
1,806
1,359
Other current liabilities
1,207
1,138
Liabilities held for sale
141
—
Total Current Liabilities
3,797
3,010
Long-Term Debt
7,535
1,895
Deferred Income Taxes
2,450
479
Other Liabilities
1,270
560
Commitments and Contingencies (Note 20)
Shareholders’ Equity:
Common stock ($0.10 par value):
Class A-authorized 900 million shares, issued 346 million shares in 2014 and 322 million shares
in 2013
35
32
Convertible Class B-authorized 900 million shares, issued 70 million shares
7
7
Capital in excess of par value
4,257
2,292
Retained earnings
5,748
4,999
Accumulated other comprehensive loss
(147
)
(108
)
Treasury stock, at cost – 40 million shares in 2014 and 48 million shares in 2013
(1,010
)
(1,021
)
Total Tyson Shareholders’ Equity
8,890
6,201
Noncontrolling Interests
14
32
Total Shareholders’ Equity
8,904
6,233
Total Liabilities and Shareholders’ Equity
$
23,956
$
12,177