Tyson Foods 2014 Annual Report Download - page 91
Download and view the complete annual report
Please find page 91 of the 2014 Tyson Foods annual report below. You can navigate through the pages in the report by either clicking on the pages listed below, or by using the keyword search tool below to find specific information within the annual report.-
 1
1 -
2
-
3
-
4
-
5
-
6
-
7
-
8
-
9
-
10
-
11
-
12
-
13
-
14
-
15
-
16
-
17
-
18
-
19
-
20
-
21
-
22
-
23
-
24
-
25
-
26
-
27
-
28
-
29
-
30
-
31
-
32
-
33
-
34
-
35
-
36
-
37
-
38
-
39
-
40
-
41
-
42
-
43
-
44
-
45
-
46
-
47
-
48
-
49
-
50
-
51
-
52
-
53
-
54
-
55
-
56
-
57
-
58
-
59
-
60
-
61
-
62
-
63
-
64
-
65
-
66
-
67
-
68
-
69
-
70
-
71
-
72
-
73
-
74
-
75
-
76
-
77
-
78
-
79
-
80
-
 81
81 -
 82
82 -
 83
83 -
 84
84 -
 85
85 -
 86
86 -
 87
87 -
 88
88 -
 89
89 -
 90
90 -
 91
91 -
 92
92 -
 93
93 -
 94
94 -
 95
95 -
 96
96 -
 97
97 -
 98
98 -
 99
99 -
 100
100 -
 101
101 -
102
-
103
-
104
-
105
-
106
-
107
-
108
-
109
-
110
-
111
-
112
-
113
-
114
-
115
-
116
-
117
-
118
-
119
-
120
-
121
-
122
-
123
-
124
-
125
-
126
-
127
-
128
-
129
-
130
-
131
-
132
-
133
-
134
-
135
-
136
-
137
-
138
-
139
-
140
-
141
-
142
-
143
-
144
-
145
-
146
-
147
-
148
-
149
-
150
-
151
-
152
-
153
-
154
-
155
-
156
-
157
-
158
-
159
-
160
-
161
-
162
-
163
-
164
-
165
-
166
-
167
-
168
-
169
-
170
-
171
-
172
-
173
-
174
-
175
-
176
-
177
-
178
-
179
-
180
-
181
-
182
-
183
-
184
-
185
-
186
-
187
-
188
-
189
-
190
-
191
-
192
-
193
-
194
-
195
-
196
-
197
-
198
-
199
-
200
-
201
-
202
-
203
-
204
-
205
-
206
-
207
-
208
-
209
-
210
-
211
-
212
-
213
-
214
-
215
-
216
-
217
-
218
-
219
-
220
-
221
-
222
-
223
-
224
-
225
-
226
-
227
-
228
 |
 |
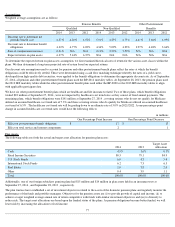
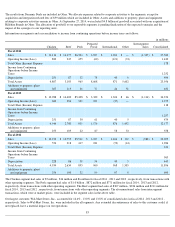
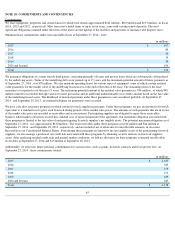
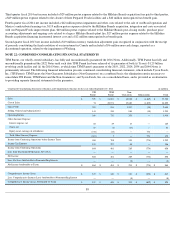
The results from Dynamic Fuels are included in Other. We allocate expenses related to corporate activities to the segments, except for
acquisition and integration related fees of $59 million which are included in Other. Assets and additions to property, plant and equipment
relating to corporate activities remain in Other. At September 27, 2014, we included $4.8 billion of goodwill associated with our acquisition of
Hillshire Brands in Other. The allocation of goodwill to our reportable segments is pending finalization of the expected synergies and the
impact of the synergies to our reporting units.
Information on segments and a reconciliation to income from continuing operations before income taxes are follows:
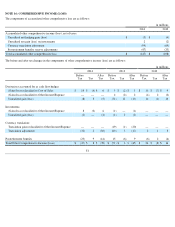
The Chicken segment had sales of $7 million , $16 million and $6 million for fiscal 2014 , 2013 and 2012
, respectively, from transactions with
other operating segments. The Pork segment had sales of $1.0 billion , $872 million and $771 million for fiscal 2014 , 2013 and 2012 ,
respectively, from transactions with other operating segments. The Beef segment had sales of $307 million , $226 million and $211 million for
fiscal 2014 , 2013 and 2012 , respectively, from transactions with other operating segments. The aforementioned sales from intersegment
transactions, which were at market prices, were included in the segment sales in the above table.
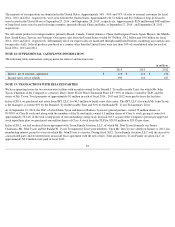
Our largest customer, Wal-Mart Stores, Inc., accounted for 14.6% , 13.0% and 13.8% of consolidated sales in fiscal 2014 , 2013 and 2012 ,
respectively. Sales to Wal-Mart Stores, Inc. were included in the all segments. Any extended discontinuance of sales to this customer could, if
not replaced, have a material impact on our operations.
83
in millions
Chicken
Beef
Pork
Prepared
Foods
International
Other
Intersegment
Sales
Consolidated
Fiscal 2014
Sales
$
11,116
$
16,177
$
6,304
$
3,927
$
1,381
$
—
$
(
1,325
)
$
37,580
Operating Income (Loss)
883
347
455
(60
)
(121
)
(74
)
1,430
Total Other (Income) Expense
178
Income from Continuing
Operations before Income
Taxes
1,252
Depreciation
251
87
32
78
40
6
494
Total Assets
4,807
3,103
965
8,608
871
5,602
23,956
Additions to property, plant
and equipment
307
115
36
77
46
51
632
Fiscal 2013
Sales
$
10,988
$
14,400
$
5,408
$
3,322
$
1,324
$
46
$
(1,114
)
$
34,374
Operating Income (Loss)
683
296
332
101
(37
)
—
1,375
Total Other (Income) Expense
118
Income from Continuing
Operations before Income
Taxes
1,257
Depreciation
251
87
30
61
40
5
474
Total Assets
4,944
2,798
931
1,176
876
1,452
12,177
Additions to property, plant
and equipment
253
105
22
87
58
33
558
Fiscal 2012
Sales
$
10,270
$
13,755
$
5,510
$
3,237
$
1,104
$
167
$
(988
)
$
33,055
Operating Income (Loss)
554
218
417
181
(70
)
(14
)
1,286
Total Other (Income) Expense
321
Income from Continuing
Operations before Income
Taxes
965
Depreciation
228
86
30
54
40
5
443
Total Assets
4,934
2,634
895
960
968
1,505
11,896
Additions to property, plant
and equipment
354
100
32
99
97
8
690