Tyson Foods 2014 Annual Report Download - page 73
Download and view the complete annual report
Please find page 73 of the 2014 Tyson Foods annual report below. You can navigate through the pages in the report by either clicking on the pages listed below, or by using the keyword search tool below to find specific information within the annual report.-
 1
1 -
2
-
3
-
4
-
5
-
6
-
7
-
8
-
9
-
10
-
11
-
12
-
13
-
14
-
15
-
16
-
17
-
18
-
19
-
20
-
21
-
22
-
23
-
24
-
25
-
26
-
27
-
28
-
29
-
30
-
31
-
32
-
33
-
34
-
35
-
36
-
37
-
38
-
39
-
40
-
41
-
42
-
43
-
44
-
45
-
46
-
47
-
48
-
49
-
50
-
51
-
52
-
53
-
54
-
55
-
56
-
57
-
58
-
59
-
60
-
61
-
62
-
 63
63 -
 64
64 -
 65
65 -
 66
66 -
 67
67 -
 68
68 -
 69
69 -
 70
70 -
 71
71 -
 72
72 -
 73
73 -
 74
74 -
 75
75 -
 76
76 -
 77
77 -
 78
78 -
 79
79 -
 80
80 -
 81
81 -
 82
82 -
 83
83 -
84
-
85
-
86
-
87
-
88
-
89
-
90
-
91
-
92
-
93
-
94
-
95
-
96
-
97
-
98
-
99
-
100
-
101
-
102
-
103
-
104
-
105
-
106
-
107
-
108
-
109
-
110
-
111
-
112
-
113
-
114
-
115
-
116
-
117
-
118
-
119
-
120
-
121
-
122
-
123
-
124
-
125
-
126
-
127
-
128
-
129
-
130
-
131
-
132
-
133
-
134
-
135
-
136
-
137
-
138
-
139
-
140
-
141
-
142
-
143
-
144
-
145
-
146
-
147
-
148
-
149
-
150
-
151
-
152
-
153
-
154
-
155
-
156
-
157
-
158
-
159
-
160
-
161
-
162
-
163
-
164
-
165
-
166
-
167
-
168
-
169
-
170
-
171
-
172
-
173
-
174
-
175
-
176
-
177
-
178
-
179
-
180
-
181
-
182
-
183
-
184
-
185
-
186
-
187
-
188
-
189
-
190
-
191
-
192
-
193
-
194
-
195
-
196
-
197
-
198
-
199
-
200
-
201
-
202
-
203
-
204
-
205
-
206
-
207
-
208
-
209
-
210
-
211
-
212
-
213
-
214
-
215
-
216
-
217
-
218
-
219
-
220
-
221
-
222
-
223
-
224
-
225
-
226
-
227
-
228
 |
 |
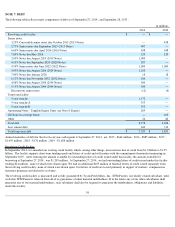
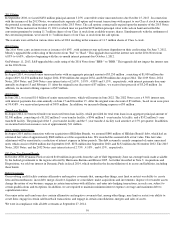
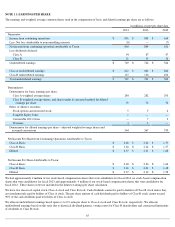
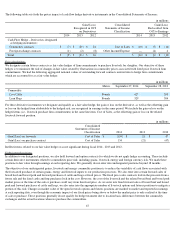
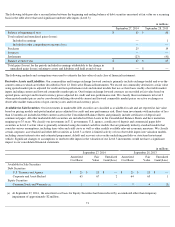
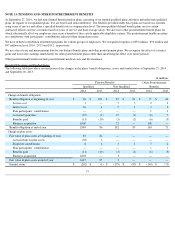
NOTE 11: EARNINGS PER SHARE
The earnings and weighted average common shares used in the computation of basic and diluted earnings per share are as follows:
We had approximately 4 million of our stock-based compensation shares that were antidilutive for fiscal 2014, no stock-based compensation
shares that were antidilutive for fiscal 2013 and approximately 4 million of our stock-based compensation shares that were antidilutive for
fiscal 2012 . These shares were not included in the dilutive earnings per share calculation.
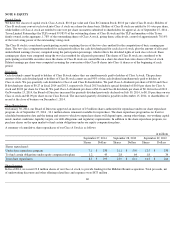
We have two classes of capital stock, Class A stock and Class B stock. Cash dividends cannot be paid to holders of Class B stock unless they
are simultaneously paid to holders of Class A stock. The per share amount of cash dividends paid to holders of Class B stock cannot exceed
90% of the cash dividends paid to holders of Class A stock.
We allocate undistributed earnings based upon a 1 to 0.9 ratio per share to Class A stock and Class B stock, respectively. We allocate
undistributed earnings based on this ratio due to historical dividend patterns, voting control of Class B shareholders and contractual limitations
of dividends to Class B stock.
65
in millions, except per share data
2014
2013
2012
Numerator:
Income from continuing operations
$
856
$
848
$
614
Less: Net loss attributable to noncontrolling interests
(8
)
—
(
7
)
Net income from continuing operations attributable to Tyson
864
848
621
Less dividends declared:
Class A
94
87
47
Class B
21
19
10
Undistributed earnings
$
749
$
742
$
564
Class A undistributed earnings
$
612
$
606
$
464
Class B undistributed earnings
137
136
100
Total undistributed earnings
$
749
$
742
$
564
Denominator:
Denominator for basic earnings per share:
Class A weighted average shares
284
282
293
Class B weighted average shares, and shares under if-converted method for diluted
earnings per share
70
70
70
Effect of dilutive securities:
Stock options and restricted stock
5
5
4
Tangible Equity Units
1
—
—
Convertible 2013 Notes
—
7
3
Warrants
4
3
—
Denominator for diluted earnings per share – adjusted weighted average shares and
assumed conversions
364
367
370
Net Income Per Share from Continuing Operations Attributable to Tyson:
Class A Basic
$
2.48
$
2.46
$
1.75
Class B Basic
$
2.26
$
2.22
$
1.57
Diluted
$
2.37
$
2.31
$
1.68
Net Income Per Share Attributable to Tyson:
Class A Basic
$
2.48
$
2.26
$
1.64
Class B Basic
$
2.26
$
2.04
$
1.48
Diluted
$
2.37
$
2.12
$
1.58