Tyson Foods 2014 Annual Report Download - page 65
Download and view the complete annual report
Please find page 65 of the 2014 Tyson Foods annual report below. You can navigate through the pages in the report by either clicking on the pages listed below, or by using the keyword search tool below to find specific information within the annual report.-
 1
1 -
2
-
3
-
4
-
5
-
6
-
7
-
8
-
9
-
10
-
11
-
12
-
13
-
14
-
15
-
16
-
17
-
18
-
19
-
20
-
21
-
22
-
23
-
24
-
25
-
26
-
27
-
28
-
29
-
30
-
31
-
32
-
33
-
34
-
35
-
36
-
37
-
38
-
39
-
40
-
41
-
42
-
43
-
44
-
45
-
46
-
47
-
48
-
49
-
50
-
51
-
52
-
53
-
54
-
 55
55 -
 56
56 -
 57
57 -
 58
58 -
 59
59 -
 60
60 -
 61
61 -
 62
62 -
 63
63 -
 64
64 -
 65
65 -
 66
66 -
 67
67 -
 68
68 -
 69
69 -
 70
70 -
 71
71 -
 72
72 -
 73
73 -
 74
74 -
 75
75 -
76
-
77
-
78
-
79
-
80
-
81
-
82
-
83
-
84
-
85
-
86
-
87
-
88
-
89
-
90
-
91
-
92
-
93
-
94
-
95
-
96
-
97
-
98
-
99
-
100
-
101
-
102
-
103
-
104
-
105
-
106
-
107
-
108
-
109
-
110
-
111
-
112
-
113
-
114
-
115
-
116
-
117
-
118
-
119
-
120
-
121
-
122
-
123
-
124
-
125
-
126
-
127
-
128
-
129
-
130
-
131
-
132
-
133
-
134
-
135
-
136
-
137
-
138
-
139
-
140
-
141
-
142
-
143
-
144
-
145
-
146
-
147
-
148
-
149
-
150
-
151
-
152
-
153
-
154
-
155
-
156
-
157
-
158
-
159
-
160
-
161
-
162
-
163
-
164
-
165
-
166
-
167
-
168
-
169
-
170
-
171
-
172
-
173
-
174
-
175
-
176
-
177
-
178
-
179
-
180
-
181
-
182
-
183
-
184
-
185
-
186
-
187
-
188
-
189
-
190
-
191
-
192
-
193
-
194
-
195
-
196
-
197
-
198
-
199
-
200
-
201
-
202
-
203
-
204
-
205
-
206
-
207
-
208
-
209
-
210
-
211
-
212
-
213
-
214
-
215
-
216
-
217
-
218
-
219
-
220
-
221
-
222
-
223
-
224
-
225
-
226
-
227
-
228
 |
 |
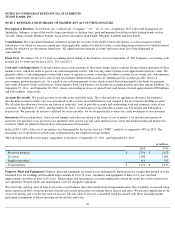
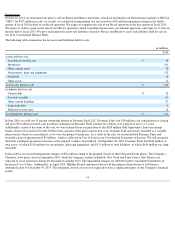
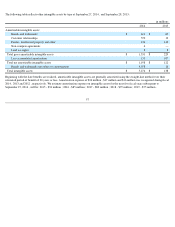
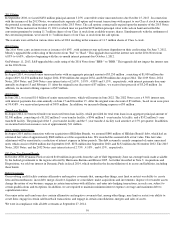
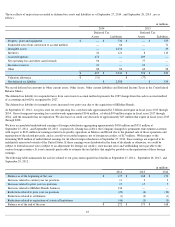
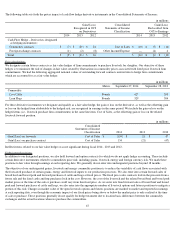
The following table reflects other intangible assets by type at September 27, 2014 , and September 28, 2013 :
Beginning with the date benefits are realized, amortizable intangible assets are generally amortized using the straight-line method over their
estimated period of benefit of 20 years or less. Amortization expense of $26 million , $17 million and $16 million was recognized during fiscal
2014 , 2013 and 2012 , respectively. We estimate amortization expense on intangible assets for the next five fiscal years subsequent to
September 27, 2014 , will be: 2015 - $94 million ; 2016 - $85 million ; 2017 - $80 million ; 2018 - $79 million ; 2019 - $75 million .
57
in millions
2014
2013
Amortizable intangible assets:
Brands and trademarks
$
611
$
69
Customer relationships
570
12
Patents, intellectual property and other
136
140
Non-compete agreements
6
—
Land use rights
8
8
Total gross amortizable intangible assets
$
1,331
$
229
Less accumulated amortization
133
107
Total net amortizable intangible assets
$
1,198
$
122
Brands and trademarks not subject to amortization
4,078
16
Total intangible assets
$
5,276
$
138