Tyson Foods 2014 Annual Report Download - page 22
Download and view the complete annual report
Please find page 22 of the 2014 Tyson Foods annual report below. You can navigate through the pages in the report by either clicking on the pages listed below, or by using the keyword search tool below to find specific information within the annual report.-
 1
1 -
2
-
3
-
4
-
5
-
6
-
7
-
8
-
9
-
10
-
11
-
 12
12 -
 13
13 -
 14
14 -
 15
15 -
 16
16 -
 17
17 -
 18
18 -
 19
19 -
 20
20 -
 21
21 -
 22
22 -
 23
23 -
 24
24 -
 25
25 -
 26
26 -
 27
27 -
 28
28 -
 29
29 -
 30
30 -
 31
31 -
 32
32 -
33
-
34
-
35
-
36
-
37
-
38
-
39
-
40
-
41
-
42
-
43
-
44
-
45
-
46
-
47
-
48
-
49
-
50
-
51
-
52
-
53
-
54
-
55
-
56
-
57
-
58
-
59
-
60
-
61
-
62
-
63
-
64
-
65
-
66
-
67
-
68
-
69
-
70
-
71
-
72
-
73
-
74
-
75
-
76
-
77
-
78
-
79
-
80
-
81
-
82
-
83
-
84
-
85
-
86
-
87
-
88
-
89
-
90
-
91
-
92
-
93
-
94
-
95
-
96
-
97
-
98
-
99
-
100
-
101
-
102
-
103
-
104
-
105
-
106
-
107
-
108
-
109
-
110
-
111
-
112
-
113
-
114
-
115
-
116
-
117
-
118
-
119
-
120
-
121
-
122
-
123
-
124
-
125
-
126
-
127
-
128
-
129
-
130
-
131
-
132
-
133
-
134
-
135
-
136
-
137
-
138
-
139
-
140
-
141
-
142
-
143
-
144
-
145
-
146
-
147
-
148
-
149
-
150
-
151
-
152
-
153
-
154
-
155
-
156
-
157
-
158
-
159
-
160
-
161
-
162
-
163
-
164
-
165
-
166
-
167
-
168
-
169
-
170
-
171
-
172
-
173
-
174
-
175
-
176
-
177
-
178
-
179
-
180
-
181
-
182
-
183
-
184
-
185
-
186
-
187
-
188
-
189
-
190
-
191
-
192
-
193
-
194
-
195
-
196
-
197
-
198
-
199
-
200
-
201
-
202
-
203
-
204
-
205
-
206
-
207
-
208
-
209
-
210
-
211
-
212
-
213
-
214
-
215
-
216
-
217
-
218
-
219
-
220
-
221
-
222
-
223
-
224
-
225
-
226
-
227
-
228
 |
 |
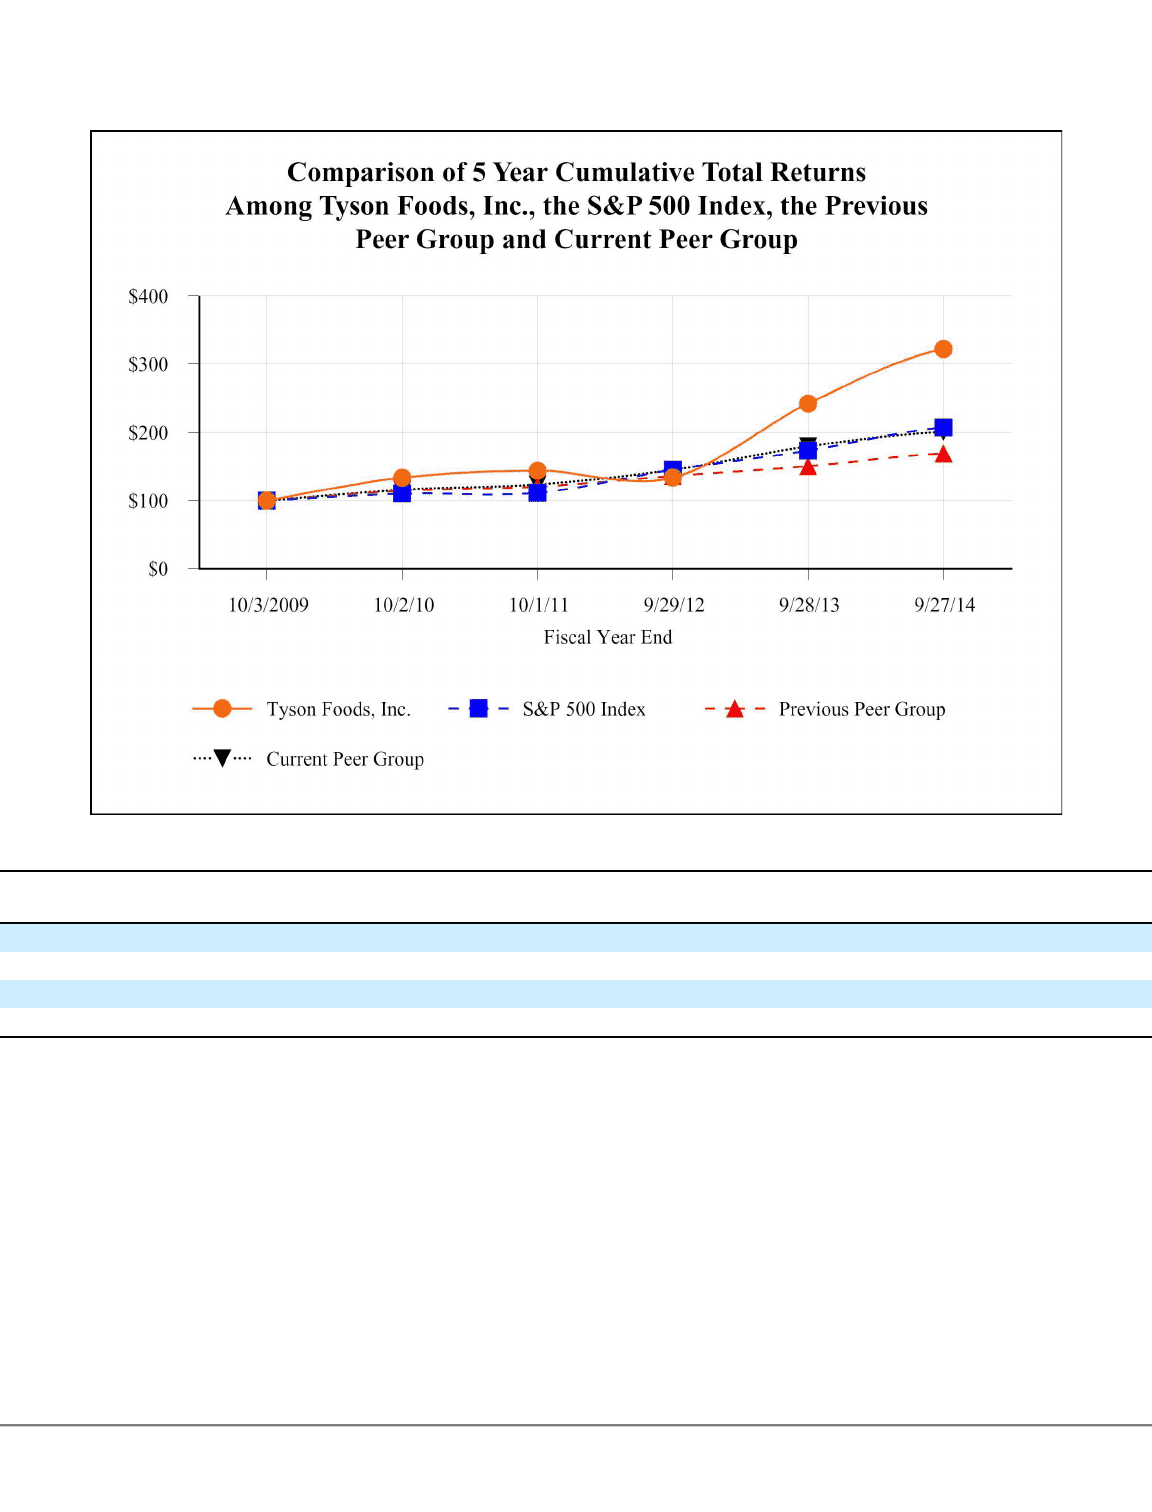
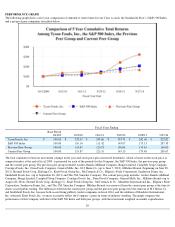
PERFORMANCE GRAPH
The following graph shows a five-year comparison of cumulative total returns for our Class A stock, the Standard & Poor’s (S&P) 500 Index
and a group of peer companies described below.
The total cumulative return on investment (change in the year-end stock price plus reinvested dividends), which is based on the stock price or
composite index at the end of fiscal 2009, is presented for each of the periods for the Company, the S&P 500 Index, the previous peer group
and the current peer group. The previous peer group included: Archer-Daniels-Midland Company, Bunge Limited, Campbell Soup Company,
ConAgra Foods, Inc., Dean Foods Company, General Mills, Inc., H.J. Heinz Co. (up to June 7, 2013), Hillshire Brands (beginning on June 28,
2012), Hormel Foods Corp., Kellogg Co., Kraft Foods Group Inc., McCormick & Co., Pilgrim’s Pride Corporation, Sanderson Farms, Inc.,
Smithfield Foods, Inc. (up to September 26, 2013) and The J.M. Smucker Company. The current peer group includes: Archer-Daniels-Midland
Company, Bunge Limited, Campbell Soup Company, ConAgra Foods, Inc., Dean Foods Company, General Mills, Inc., Hillshire Brands (up to
August 28, 2014), Hormel Foods Corp., Kellogg Co., Kraft Foods Group Inc., McCormick & Co., Mondelez Interenational Inc., Pilgrim's Pride
Corporation, Sanderson Farms, Inc., and The J.M. Smucker Company. Hillshire Brands was removed from the current peer group at the time its
shares ceased public trading. The differences between the current peer group and the previous peer group were the removal of H.J. Heinz Co.
and Smithfield Foods, Inc. because both ceased being publicly traded companies in fiscal 2014, and the addition of Mondelez International,
Inc. (formerly Kraft Foods, Inc.) to more accurately reflect the Company’s peers in terms of industry standing. The graph compares the
performance of the Company with that of the S&P 500 Index and both peer groups, with the investment weighted on market capitalization.
20
Fiscal Years Ending
Base Period
10/3/09
10/2/10
10/1/11
9/29/12
9/28/13
9/27/14
Tyson Foods, Inc.
$
100.00
$
133.34
$
143.66
$
133.73
$
242.06
$
322.02
S&P 500 Index
100.00
110.16
111.42
145.07
173.13
207.30
Previous Peer Group
100.00
114.42
120.23
136.08
150.45
169.01
Current Peer Group
100.00
115.87
123.31
145.13
179.48
200.67