Tyson Foods 2014 Annual Report Download - page 80
Download and view the complete annual report
Please find page 80 of the 2014 Tyson Foods annual report below. You can navigate through the pages in the report by either clicking on the pages listed below, or by using the keyword search tool below to find specific information within the annual report.-
 1
1 -
2
-
3
-
4
-
5
-
6
-
7
-
8
-
9
-
10
-
11
-
12
-
13
-
14
-
15
-
16
-
17
-
18
-
19
-
20
-
21
-
22
-
23
-
24
-
25
-
26
-
27
-
28
-
29
-
30
-
31
-
32
-
33
-
34
-
35
-
36
-
37
-
38
-
39
-
40
-
41
-
42
-
43
-
44
-
45
-
46
-
47
-
48
-
49
-
50
-
51
-
52
-
53
-
54
-
55
-
56
-
57
-
58
-
59
-
60
-
61
-
62
-
63
-
64
-
65
-
66
-
67
-
68
-
69
-
 70
70 -
 71
71 -
 72
72 -
 73
73 -
 74
74 -
 75
75 -
 76
76 -
 77
77 -
 78
78 -
 79
79 -
 80
80 -
 81
81 -
 82
82 -
 83
83 -
 84
84 -
 85
85 -
 86
86 -
 87
87 -
 88
88 -
 89
89 -
 90
90 -
91
-
92
-
93
-
94
-
95
-
96
-
97
-
98
-
99
-
100
-
101
-
102
-
103
-
104
-
105
-
106
-
107
-
108
-
109
-
110
-
111
-
112
-
113
-
114
-
115
-
116
-
117
-
118
-
119
-
120
-
121
-
122
-
123
-
124
-
125
-
126
-
127
-
128
-
129
-
130
-
131
-
132
-
133
-
134
-
135
-
136
-
137
-
138
-
139
-
140
-
141
-
142
-
143
-
144
-
145
-
146
-
147
-
148
-
149
-
150
-
151
-
152
-
153
-
154
-
155
-
156
-
157
-
158
-
159
-
160
-
161
-
162
-
163
-
164
-
165
-
166
-
167
-
168
-
169
-
170
-
171
-
172
-
173
-
174
-
175
-
176
-
177
-
178
-
179
-
180
-
181
-
182
-
183
-
184
-
185
-
186
-
187
-
188
-
189
-
190
-
191
-
192
-
193
-
194
-
195
-
196
-
197
-
198
-
199
-
200
-
201
-
202
-
203
-
204
-
205
-
206
-
207
-
208
-
209
-
210
-
211
-
212
-
213
-
214
-
215
-
216
-
217
-
218
-
219
-
220
-
221
-
222
-
223
-
224
-
225
-
226
-
227
-
228
 |
 |

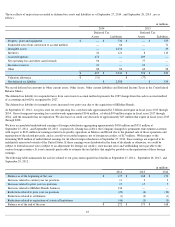
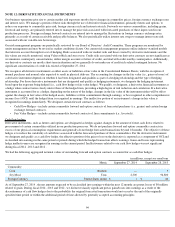
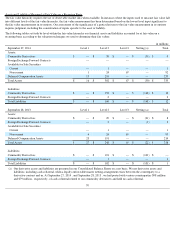
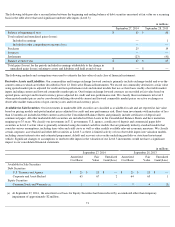
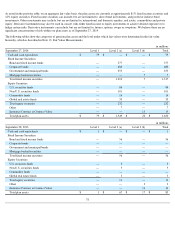
Unrealized holding gains (losses), net of tax, are excluded from earnings and reported in OCI until the security is settled or sold. On a quarterly
basis, we evaluate whether losses related to our available-for-sale securities are temporary in nature. Losses on equity securities are recognized
in earnings if the decline in value is judged to be other than temporary. If losses related to our debt securities are determined to be other than
temporary, the loss would be recognized in earnings if we intend, or more likely than not will be required, to sell the security prior to recovery.
For debt securities in which we have the intent and ability to hold until maturity, losses determined to be other than temporary would remain in
OCI, other than expected credit losses which are recognized in earnings. We consider many factors in determining whether a loss is temporary,
including the length of time and extent to which the fair value has been below cost, the financial condition and near-
term prospects of the issuer
and our ability and intent to hold the investment for a period of time sufficient to allow for any anticipated recovery. We recognized $6 million
of other than temporary impairment for the year ended September 27, 2014 , which is recorded in the Consolidated Statements of Income in
Other, net. No other than temporary losses were deferred in OCI as of September 27, 2014 , and September 28, 2013 .
Deferred Compensation Assets: We maintain non-
qualified deferred compensation plans for certain executives and other highly compensated
employees. Investments are generally maintained within a trust and include money market funds, mutual funds and life insurance policies. The
cash surrender value of the life insurance policies is invested primarily in mutual funds. The investments are recorded at fair value based on
quoted market prices and are included in Other Assets in the Consolidated Balance Sheets. We classify the investments which have observable
market prices in active markets in Level 1 as these are generally publicly-traded mutual funds. The remaining deferred compensation assets are
classified in Level 2, as fair value can be corroborated based on observable market data. Realized and unrealized gains (losses) on deferred
compensation are included in earnings.
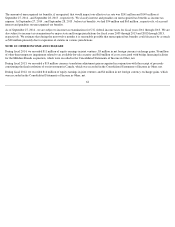
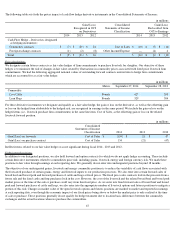
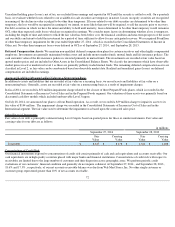
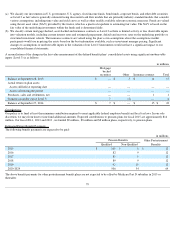
Assets and Liabilities Measured at Fair Value on a Nonrecurring Basis
In addition to assets and liabilities that are recorded at fair value on a recurring basis, we record assets and liabilities at fair value on a
nonrecurring basis. Generally, assets are recorded at fair value on a nonrecurring basis as a result of impairment charges.
In fiscal 2014, we recorded a $52 million impairment charge related to the closure of three Prepared Foods plants, which is recorded in the
Consolidated Statements of Income in Cost of Sales and in the Prepared Foods segment. Our valuation of these assets was primarily based on
discounted cash flow models which included unobservable Level 3 inputs.
On July 28, 2014, we announced our plan to sell our Brazil operation. As a result, we recorded a $39 million charge to impair its assets to its
fair value of $144 million . The impairment charge was recorded in the Consolidated Statements of Income in Cost of Sales and in the
International segment. The fair value used to determine the impairment was based upon the contracted sales price.
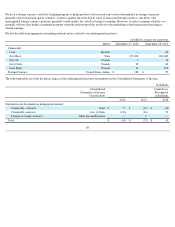
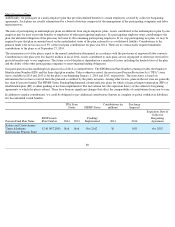
Other Financial Instruments
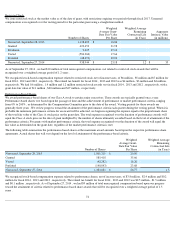
Fair value of our debt is principally estimated using Level 2 inputs based on quoted prices for those or similar instruments. Fair value and
carrying value for our debt are as follows:
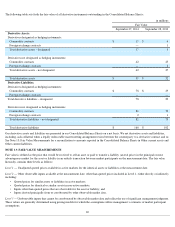
Concentrations of Credit Risk
Our financial instruments exposed to concentrations of credit risk consist primarily of cash and cash equivalents and accounts receivable. Our
cash equivalents are in high quality securities placed with major banks and financial institutions. Concentrations of credit risk with respect to
receivables are limited due to the large number of customers and their dispersion across geographic areas. We perform periodic credit
evaluations of our customers’ financial condition and generally do not require collateral. At September 27, 2014 , and September 28, 2013 ,
18.6% and 17.5% , respectively, of our net accounts receivable balance was due from Wal-Mart Stores, Inc. No other single customer or
customer group represented greater than 10% of net accounts receivable.
72
in millions
September 27, 2014
September 28, 2013
Fair
Value
Carrying
Value
Fair
Value
Carrying
Value
Total Debt
$
8,347
$
8,178
$
2,541
$
2,408