Tyson Foods 2014 Annual Report Download - page 36
Download and view the complete annual report
Please find page 36 of the 2014 Tyson Foods annual report below. You can navigate through the pages in the report by either clicking on the pages listed below, or by using the keyword search tool below to find specific information within the annual report.-
 1
1 -
2
-
3
-
4
-
5
-
6
-
7
-
8
-
9
-
10
-
11
-
12
-
13
-
14
-
15
-
16
-
17
-
18
-
19
-
20
-
21
-
22
-
23
-
24
-
25
-
 26
26 -
 27
27 -
 28
28 -
 29
29 -
 30
30 -
 31
31 -
 32
32 -
 33
33 -
 34
34 -
 35
35 -
 36
36 -
 37
37 -
 38
38 -
 39
39 -
 40
40 -
 41
41 -
 42
42 -
 43
43 -
 44
44 -
 45
45 -
 46
46 -
47
-
48
-
49
-
50
-
51
-
52
-
53
-
54
-
55
-
56
-
57
-
58
-
59
-
60
-
61
-
62
-
63
-
64
-
65
-
66
-
67
-
68
-
69
-
70
-
71
-
72
-
73
-
74
-
75
-
76
-
77
-
78
-
79
-
80
-
81
-
82
-
83
-
84
-
85
-
86
-
87
-
88
-
89
-
90
-
91
-
92
-
93
-
94
-
95
-
96
-
97
-
98
-
99
-
100
-
101
-
102
-
103
-
104
-
105
-
106
-
107
-
108
-
109
-
110
-
111
-
112
-
113
-
114
-
115
-
116
-
117
-
118
-
119
-
120
-
121
-
122
-
123
-
124
-
125
-
126
-
127
-
128
-
129
-
130
-
131
-
132
-
133
-
134
-
135
-
136
-
137
-
138
-
139
-
140
-
141
-
142
-
143
-
144
-
145
-
146
-
147
-
148
-
149
-
150
-
151
-
152
-
153
-
154
-
155
-
156
-
157
-
158
-
159
-
160
-
161
-
162
-
163
-
164
-
165
-
166
-
167
-
168
-
169
-
170
-
171
-
172
-
173
-
174
-
175
-
176
-
177
-
178
-
179
-
180
-
181
-
182
-
183
-
184
-
185
-
186
-
187
-
188
-
189
-
190
-
191
-
192
-
193
-
194
-
195
-
196
-
197
-
198
-
199
-
200
-
201
-
202
-
203
-
204
-
205
-
206
-
207
-
208
-
209
-
210
-
211
-
212
-
213
-
214
-
215
-
216
-
217
-
218
-
219
-
220
-
221
-
222
-
223
-
224
-
225
-
226
-
227
-
228
 |
 |

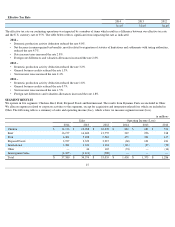
LIQUIDITY AND CAPITAL RESOURCES
Our cash needs for working capital, capital expenditures, growth opportunities, the repurchases of senior notes, repayment of term loans and
share repurchases are expected to be met with current cash on hand, cash flows provided by operating activities, or short-term borrowings.
Based on our current expectations, we believe our liquidity and capital resources will be sufficient to operate our business. However, we may
take advantage of opportunities to generate additional liquidity or refinance existing debt through capital market transactions. The amount,
nature and timing of any capital market transactions will depend on our operating performance and other circumstances; our then-current
commitments and obligations; the amount, nature and timing of our capital requirements; any limitations imposed by our current credit
arrangements; and overall market conditions.
31
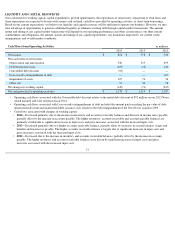
Cash Flows from Operating Activities
in millions
2014
2013
2012
Net income
$
856
$
778
$
576
Non-cash items in net income:
Depreciation and amortization
530
519
499
Deferred income taxes
(105
)
(12
)
140
Convertible debt discount
(92
)
—
—
Loss on early extinguishment of debt —
—
167
Impairment of assets
107
74
34
Other, net
31
26
18
Net changes in working capital
(149
)
(71
)
(247
)
Net cash provided by operating activities
$
1,178
$
1,314
$
1,187
•
Operating cash flows associated with the Convertible debt discount relates to the initial debt discount of $92 million on our 2013 Notes,
which matured and were retired in fiscal 2014.
• Operating cash flows associated with Loss on early extinguishment of debt included the amount paid exceeding the par value of debt,
unamortized discount and unamortized debt issuance costs related to the full extinguishment of the 2014 Notes issued in 2009.
•
Cash flows associated with changes in working capital:
• 2014 – Decreased primarily due to the increase in inventory and accounts receivable balances and decrease in income taxes payable,
partially offset by the increase in accounts payable. The higher inventory, accounts receivable and accounts payable balances are
primarily attributable to significant increases in input costs and price increases associated with the increased input costs.
• 2013 – Decreased primarily due to a higher accounts receivable balance, partially offset by increases in accrued salaries, wages and
benefits and income tax payable. The higher accounts receivable balance is largely due to significant increases in input costs and
price increases associated with the increased input costs.
• 2012 – Decreased due to the increase in inventory and accounts receivable balances, partially offset by the increase in accounts
payable. The higher inventory and accounts receivable balances were driven by significant increases in input costs and price
increases associated with the increased input costs.