Tyson Foods 2014 Annual Report Download - page 29
Download and view the complete annual report
Please find page 29 of the 2014 Tyson Foods annual report below. You can navigate through the pages in the report by either clicking on the pages listed below, or by using the keyword search tool below to find specific information within the annual report.-
 1
1 -
2
-
3
-
4
-
5
-
6
-
7
-
8
-
9
-
10
-
11
-
12
-
13
-
14
-
15
-
16
-
17
-
18
-
 19
19 -
 20
20 -
 21
21 -
 22
22 -
 23
23 -
 24
24 -
 25
25 -
 26
26 -
 27
27 -
 28
28 -
 29
29 -
 30
30 -
 31
31 -
 32
32 -
 33
33 -
 34
34 -
 35
35 -
 36
36 -
 37
37 -
 38
38 -
 39
39 -
40
-
41
-
42
-
43
-
44
-
45
-
46
-
47
-
48
-
49
-
50
-
51
-
52
-
53
-
54
-
55
-
56
-
57
-
58
-
59
-
60
-
61
-
62
-
63
-
64
-
65
-
66
-
67
-
68
-
69
-
70
-
71
-
72
-
73
-
74
-
75
-
76
-
77
-
78
-
79
-
80
-
81
-
82
-
83
-
84
-
85
-
86
-
87
-
88
-
89
-
90
-
91
-
92
-
93
-
94
-
95
-
96
-
97
-
98
-
99
-
100
-
101
-
102
-
103
-
104
-
105
-
106
-
107
-
108
-
109
-
110
-
111
-
112
-
113
-
114
-
115
-
116
-
117
-
118
-
119
-
120
-
121
-
122
-
123
-
124
-
125
-
126
-
127
-
128
-
129
-
130
-
131
-
132
-
133
-
134
-
135
-
136
-
137
-
138
-
139
-
140
-
141
-
142
-
143
-
144
-
145
-
146
-
147
-
148
-
149
-
150
-
151
-
152
-
153
-
154
-
155
-
156
-
157
-
158
-
159
-
160
-
161
-
162
-
163
-
164
-
165
-
166
-
167
-
168
-
169
-
170
-
171
-
172
-
173
-
174
-
175
-
176
-
177
-
178
-
179
-
180
-
181
-
182
-
183
-
184
-
185
-
186
-
187
-
188
-
189
-
190
-
191
-
192
-
193
-
194
-
195
-
196
-
197
-
198
-
199
-
200
-
201
-
202
-
203
-
204
-
205
-
206
-
207
-
208
-
209
-
210
-
211
-
212
-
213
-
214
-
215
-
216
-
217
-
218
-
219
-
220
-
221
-
222
-
223
-
224
-
225
-
226
-
227
-
228
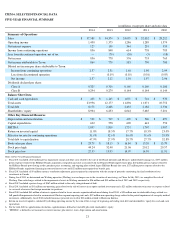
 |
 |

2014 vs. 2013 –
2013 vs. 2012 –
2014 vs. 2013 –
2013 vs. 2012 –
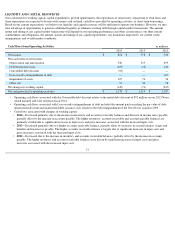
25
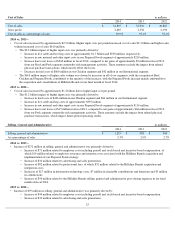
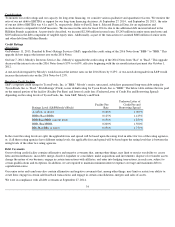
Cost of Sales
in millions
2014
2013
2012
Cost of sales
$
34,895
$
32,016
$
30,865
Gross profit
2,685
2,358
2,190
Cost of sales as a percentage of sales
92.9
%
93.1
%
93.4
%
• Cost of sales increased by approximately $2.9 billion. Higher input costs per pound increased cost of sales $2.3 billion and higher sales
volume increased cost of sales $610 million.
•
The $2.3 billion impact of higher input costs was primarily driven by:
•
Increase in live cattle and live hog costs of approximately $1.7 billion and $550 million, respectively.
•
Increase in raw material and other input costs in our Prepared Foods segment of approximately $210 million.
• Increase due to net losses of $260 million in fiscal 2014, compared to net gains of approximately $5 million in fiscal 2013,
from our Beef and Pork segment commodity risk management activities. These amounts exclude the impact from related
physical purchase transactions, which mostly offset the losses.
•
Decrease in feed costs of $600 million in our Chicken segment and $42 million in our International segment.
• The $610 million impact of higher sales volume was driven by increases in all of our segments, with the exception of Beef.
Chicken and Prepared Foods contributed to the majority of the increase, with the Prepared Foods increase mainly attributable to
the acquisition and consolidation of Hillshire Brands in our final month of fiscal 2014.
•
Cost of sales increased by approximately $1.2 billion due to higher input cost per pound.
•
The $1.2 billion impact of higher input costs was primarily driven by:
•
Increase in feed costs of $406 million in our Chicken segment and $64 million in our International segment.
•
Increase in live cattle and hog costs of approximately $395 million.
•
Increase in raw material and other input costs in our Prepared Foods segment of approximately $110 million.
• Increase due to net losses of $15 million in fiscal 2013, compared to net gains of approximately $66 million in fiscal 2012,
from our Pork segment commodity risk management activities. These amounts exclude the impact from related physical
purchase transactions, which impact future period operating results.
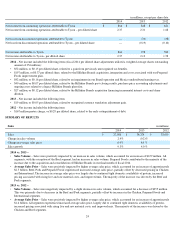
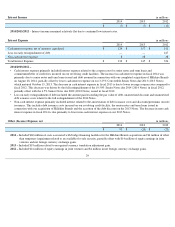
Selling, General and Administrative
in millions
2014
2013
2012
Selling, general and administrative
$
1,255
$
983
$
904
As a percentage of sales
3.3
%
2.9
%
2.7
%
•
Increase of $272 million in selling, general and administrative was primarily driven by:
• Increase of $71 million related to employee costs including payroll and stock-based and incentive-based compensation, of
which $19 million related to employee severance and retention costs associated with the Hillshire Brands acquisition and
implementation of our Prepared Foods strategy.
•
Increase of $32 million related to advertising and sales promotions.
• Increase of $82 million related to professional fees, of which $52 million related to the Hillshire Brands acquisition and
integration costs.
• Increases of $17 million in information technology costs, $7 million in charitable contributions and donations and $5 million
in commissions.
• Increase of $50 million related to the Hillshire Brands selling, general and administrative post-closing expenses in our final
month of fiscal 2014.
•
Increase of $79 million in selling, general and administrative was primarily driven by:
• Increase of $44 million related to employee costs including payroll and stock-based and incentive-
based compensation.
•
Increase of $32 million related to advertising and sales promotions.