Tyson Foods 2014 Annual Report Download - page 50
Download and view the complete annual report
Please find page 50 of the 2014 Tyson Foods annual report below. You can navigate through the pages in the report by either clicking on the pages listed below, or by using the keyword search tool below to find specific information within the annual report.-
 1
1 -
2
-
3
-
4
-
5
-
6
-
7
-
8
-
9
-
10
-
11
-
12
-
13
-
14
-
15
-
16
-
17
-
18
-
19
-
20
-
21
-
22
-
23
-
24
-
25
-
26
-
27
-
28
-
29
-
30
-
31
-
32
-
33
-
34
-
35
-
36
-
37
-
38
-
39
-
 40
40 -
 41
41 -
 42
42 -
 43
43 -
 44
44 -
 45
45 -
 46
46 -
 47
47 -
 48
48 -
 49
49 -
 50
50 -
 51
51 -
 52
52 -
 53
53 -
 54
54 -
 55
55 -
 56
56 -
 57
57 -
 58
58 -
 59
59 -
 60
60 -
61
-
62
-
63
-
64
-
65
-
66
-
67
-
68
-
69
-
70
-
71
-
72
-
73
-
74
-
75
-
76
-
77
-
78
-
79
-
80
-
81
-
82
-
83
-
84
-
85
-
86
-
87
-
88
-
89
-
90
-
91
-
92
-
93
-
94
-
95
-
96
-
97
-
98
-
99
-
100
-
101
-
102
-
103
-
104
-
105
-
106
-
107
-
108
-
109
-
110
-
111
-
112
-
113
-
114
-
115
-
116
-
117
-
118
-
119
-
120
-
121
-
122
-
123
-
124
-
125
-
126
-
127
-
128
-
129
-
130
-
131
-
132
-
133
-
134
-
135
-
136
-
137
-
138
-
139
-
140
-
141
-
142
-
143
-
144
-
145
-
146
-
147
-
148
-
149
-
150
-
151
-
152
-
153
-
154
-
155
-
156
-
157
-
158
-
159
-
160
-
161
-
162
-
163
-
164
-
165
-
166
-
167
-
168
-
169
-
170
-
171
-
172
-
173
-
174
-
175
-
176
-
177
-
178
-
179
-
180
-
181
-
182
-
183
-
184
-
185
-
186
-
187
-
188
-
189
-
190
-
191
-
192
-
193
-
194
-
195
-
196
-
197
-
198
-
199
-
200
-
201
-
202
-
203
-
204
-
205
-
206
-
207
-
208
-
209
-
210
-
211
-
212
-
213
-
214
-
215
-
216
-
217
-
218
-
219
-
220
-
221
-
222
-
223
-
224
-
225
-
226
-
227
-
228
 |
 |
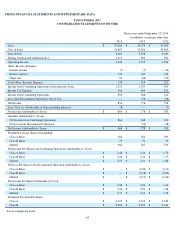
ITEM 8. FINANCIAL STATEMENTS AND SUPPLEMENTARY DATA
TYSON FOODS, INC.
CONSOLIDATED STATEMENTS OF INCOME
See accompanying notes.
44
Three years ended September 27, 2014
in millions, except per share data
2014
2013
2012
Sales
$
37,580
$
34,374
$
33,055
Cost of Sales
34,895
32,016
30,865
Gross Profit
2,685
2,358
2,190
Selling, General and Administrative
1,255
983
904
Operating Income
1,430
1,375
1,286
Other (Income) Expense:
Interest income
(7
)
(7
)
(12
)
Interest expense
132
145
356
Other, net
53
(20
)
(23
)
Total Other (Income) Expense
178
118
321
Income from Continuing Operations before Income Taxes
1,252
1,257
965
Income Tax Expense
396
409
351
Income from Continuing Operations
856
848
614
Loss from Discontinued Operation, Net of Tax
—
(
70
)
(38
)
Net Income
856
778
576
Less: Net Loss Attributable to Noncontrolling Interests
(8
)
—
(
7
)
Net Income Attributable to Tyson
$
864
$
778
$
583
Amounts Attributable to Tyson:
Net Income from Continuing Operations
864
848
621
Net Loss from Discontinued Operation
—
(
70
)
(38
)
Net Income Attributable to Tyson
$
864
$
778
$
583
Weighted Average Shares Outstanding:
Class A Basic
284
282
293
Class B Basic
70
70
70
Diluted
364
367
370
Net Income Per Share from Continuing Operations Attributable to Tyson:
Class A Basic
$
2.48
$
2.46
$
1.75
Class B Basic
$
2.26
$
2.22
$
1.57
Diluted
$
2.37
$
2.31
$
1.68
Net Loss Per Share from Discontinued Operation Attributable to Tyson:
Class A Basic
$
—
$
(
0.20
)
$
(0.11
)
Class B Basic
$
—
$
(
0.18
)
$
(0.09
)
Diluted
$
—
$
(
0.19
)
$
(0.10
)
Net Income Per Share Attributable to Tyson:
Class A Basic
$
2.48
$
2.26
$
1.64
Class B Basic
$
2.26
$
2.04
$
1.48
Diluted
$
2.37
$
2.12
$
1.58
Dividends Declared Per Share:
Class A
$
0.325
$
0.310
$
0.160
Class B
$
0.294
$
0.279
$
0.144