Tyson Foods 2014 Annual Report Download - page 88
Download and view the complete annual report
Please find page 88 of the 2014 Tyson Foods annual report below. You can navigate through the pages in the report by either clicking on the pages listed below, or by using the keyword search tool below to find specific information within the annual report.-
 1
1 -
2
-
3
-
4
-
5
-
6
-
7
-
8
-
9
-
10
-
11
-
12
-
13
-
14
-
15
-
16
-
17
-
18
-
19
-
20
-
21
-
22
-
23
-
24
-
25
-
26
-
27
-
28
-
29
-
30
-
31
-
32
-
33
-
34
-
35
-
36
-
37
-
38
-
39
-
40
-
41
-
42
-
43
-
44
-
45
-
46
-
47
-
48
-
49
-
50
-
51
-
52
-
53
-
54
-
55
-
56
-
57
-
58
-
59
-
60
-
61
-
62
-
63
-
64
-
65
-
66
-
67
-
68
-
69
-
70
-
71
-
72
-
73
-
74
-
75
-
76
-
77
-
 78
78 -
 79
79 -
 80
80 -
 81
81 -
 82
82 -
 83
83 -
 84
84 -
 85
85 -
 86
86 -
 87
87 -
 88
88 -
 89
89 -
 90
90 -
 91
91 -
 92
92 -
 93
93 -
 94
94 -
 95
95 -
 96
96 -
 97
97 -
 98
98 -
99
-
100
-
101
-
102
-
103
-
104
-
105
-
106
-
107
-
108
-
109
-
110
-
111
-
112
-
113
-
114
-
115
-
116
-
117
-
118
-
119
-
120
-
121
-
122
-
123
-
124
-
125
-
126
-
127
-
128
-
129
-
130
-
131
-
132
-
133
-
134
-
135
-
136
-
137
-
138
-
139
-
140
-
141
-
142
-
143
-
144
-
145
-
146
-
147
-
148
-
149
-
150
-
151
-
152
-
153
-
154
-
155
-
156
-
157
-
158
-
159
-
160
-
161
-
162
-
163
-
164
-
165
-
166
-
167
-
168
-
169
-
170
-
171
-
172
-
173
-
174
-
175
-
176
-
177
-
178
-
179
-
180
-
181
-
182
-
183
-
184
-
185
-
186
-
187
-
188
-
189
-
190
-
191
-
192
-
193
-
194
-
195
-
196
-
197
-
198
-
199
-
200
-
201
-
202
-
203
-
204
-
205
-
206
-
207
-
208
-
209
-
210
-
211
-
212
-
213
-
214
-
215
-
216
-
217
-
218
-
219
-
220
-
221
-
222
-
223
-
224
-
225
-
226
-
227
-
228
 |
 |

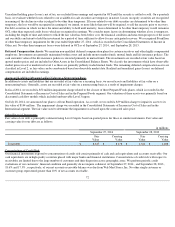
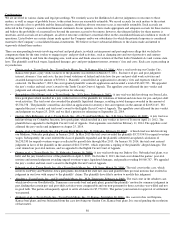
Multi-Employer Plans
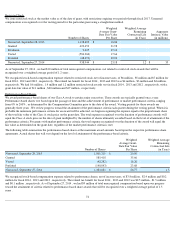
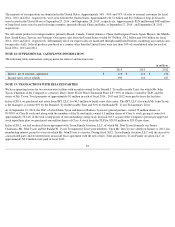
Additionally, we participate in a multi-employer plan that provides defined benefits to certain employees covered by collective bargaining
agreements. Such plans are usually administered by a board of trustees composed of the management of the participating companies and labor
representatives.
The risks of participating in multiemployer plans are different from single-
employer plans. Assets contributed to the multiemployer plan by one
employer may be used to provide benefits to employees of other participating employers. If a participating employer stops contributing to the
plan, the unfunded obligation of the plan may be borne by the remaining participating employers. If we stop participating in a plan, we may be
required to pay that plan an amount based on the underfunded status of the plan, referred to as a withdrawal liability. Contributions to the
pension funds were not in excess of 5% of the total plan contributions for plan year 2014. There are no contractually required minimum
contributions to the plans as of September 27, 2014.
The net pension cost of the plan is equal to the annual contribution determined in accordance with the provisions of negotiated labor contracts.
Contributions to the plan were less than $1 million in fiscal 2014. Assets contributed to such plans are not segregated or otherwise restricted to
provide benefits only to our employees. The future cost of the plan is dependent on a number of factors including the funded status of the plan
and the ability of the other participating companies to meet ongoing funding obligations.
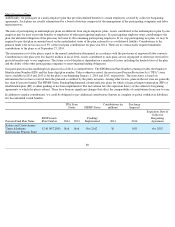
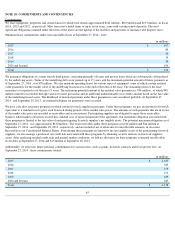
Our participation in this multiemployer plan for fiscal 2014 is outlined below. The EIN/Pension Plan Number column provides the Employer
Identification Number (EIN) and the three digit plan number. Unless otherwise noted, the most recent Pension Protection Act ("PPA") zone
status available in 2014 and 2013 is for the plan's year beginning January 1, 2014 and 2013, respectively. The zone status is based on
information that we have received from the plan and is certified by the plan's actuaries. Among other factors, plans in the red zone are generally
less than 65 percent funded. The FIP/RP Status Pending/Implemented column indicates plans for which a financial improvement plan (FIP) or
rehabilitation plan (RP) is either pending or has been implemented. The last column lists the expiration date(s) of the collective-bargaining
agreements to which the plan is subject. There have been no significant changes that affect the comparability of contributions from year to year.
In addition to regular contributions, we could be obligated to pay additional contributions (known as complete or partial withdrawal liabilities)
if it has unfunded vested benefits.
80
PPA Zone
Status
FIP/RP Status Contributions (in
millions)
Surcharge
Imposed
Pension Fund Plan Name EIN/Pension
Plan Number
2014
2013
Pending/
Implemented 2014
2014
Expiration Date of
Collective
Bargaining
Agreement
Bakery and Confectionary
Union & Industry
International Pension Fund 52-
6118572/001
Red
Red
Nov 2012
$1
10%
Oct 2015