Tyson Foods 2014 Annual Report Download - page 39
Download and view the complete annual report
Please find page 39 of the 2014 Tyson Foods annual report below. You can navigate through the pages in the report by either clicking on the pages listed below, or by using the keyword search tool below to find specific information within the annual report.-
 1
1 -
2
-
3
-
4
-
5
-
6
-
7
-
8
-
9
-
10
-
11
-
12
-
13
-
14
-
15
-
16
-
17
-
18
-
19
-
20
-
21
-
22
-
23
-
24
-
25
-
26
-
27
-
28
-
 29
29 -
 30
30 -
 31
31 -
 32
32 -
 33
33 -
 34
34 -
 35
35 -
 36
36 -
 37
37 -
 38
38 -
 39
39 -
 40
40 -
 41
41 -
 42
42 -
 43
43 -
 44
44 -
 45
45 -
 46
46 -
 47
47 -
 48
48 -
 49
49 -
50
-
51
-
52
-
53
-
54
-
55
-
56
-
57
-
58
-
59
-
60
-
61
-
62
-
63
-
64
-
65
-
66
-
67
-
68
-
69
-
70
-
71
-
72
-
73
-
74
-
75
-
76
-
77
-
78
-
79
-
80
-
81
-
82
-
83
-
84
-
85
-
86
-
87
-
88
-
89
-
90
-
91
-
92
-
93
-
94
-
95
-
96
-
97
-
98
-
99
-
100
-
101
-
102
-
103
-
104
-
105
-
106
-
107
-
108
-
109
-
110
-
111
-
112
-
113
-
114
-
115
-
116
-
117
-
118
-
119
-
120
-
121
-
122
-
123
-
124
-
125
-
126
-
127
-
128
-
129
-
130
-
131
-
132
-
133
-
134
-
135
-
136
-
137
-
138
-
139
-
140
-
141
-
142
-
143
-
144
-
145
-
146
-
147
-
148
-
149
-
150
-
151
-
152
-
153
-
154
-
155
-
156
-
157
-
158
-
159
-
160
-
161
-
162
-
163
-
164
-
165
-
166
-
167
-
168
-
169
-
170
-
171
-
172
-
173
-
174
-
175
-
176
-
177
-
178
-
179
-
180
-
181
-
182
-
183
-
184
-
185
-
186
-
187
-
188
-
189
-
190
-
191
-
192
-
193
-
194
-
195
-
196
-
197
-
198
-
199
-
200
-
201
-
202
-
203
-
204
-
205
-
206
-
207
-
208
-
209
-
210
-
211
-
212
-
213
-
214
-
215
-
216
-
217
-
218
-
219
-
220
-
221
-
222
-
223
-
224
-
225
-
226
-
227
-
228
 |
 |

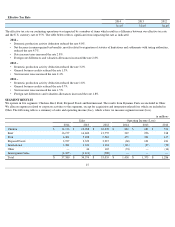
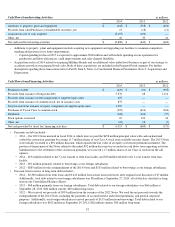
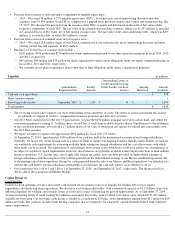
Capitalization
To monitor our credit ratings and our capacity for long-
term financing, we consider various qualitative and quantitative factors. We monitor the
ratio of our net debt to EBITDA as support for our long-term financing decisions. At September 27, 2014 , and September 28, 2013 , the ratio
of our net debt to EBITDA was 4.1x and 0.7x, respectively. Refer to Part II, Item 6, Selected Financial Data, for an explanation and
reconciliation to comparable GAAP measures. The increase in this ratio for fiscal 2014 is due to the additional debt incurred related to the
Hillshire Brands acquisition. As previously described, we incurred $2,300 million in term loans, $3,243 million in senior unsecured notes and
$205 million in the debt component of tangible equity units. Additionally, as part of the transaction we assumed $868 million of senior notes
and other debt from Hillshire Brands.
Credit Ratings
2016 Notes
On February 11, 2013, Standard & Poor's Ratings Services (S&P), upgraded the credit rating of the 2016 Notes from "BBB-" to "BBB." This
upgrade did not impact the interest rate on the 2016 Notes.
On June 7, 2012, Moody's Investors Service, Inc. (Moody's) upgraded the credit rating of the 2016 Notes from "Ba1" to "Baa3." This upgrade
decreased the interest rate on the 2016 Notes from 6.85% to 6.60%, effective beginning with the six-month interest payment due October 1,
2012.
A one-notch downgrade by Moody's would increase the interest rates on the 2016 Notes by 0.25%. A two-notch downgrade from S&P would
increase the interest rates on the 2016 Notes by 0.25%.
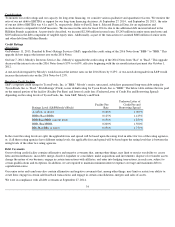
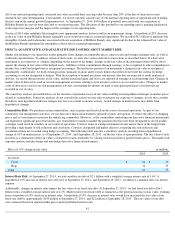
Revolving Credit Facility
S&P’s corporate credit rating for Tyson Foods, Inc. is "BBB." Moody’s senior, unsecured, subsidiary guaranteed long-term debt rating for
Tyson Foods, Inc. is "Baa3." Fitch Ratings' (Fitch), issuer default rating for Tyson Foods, Inc. is "BBB." The below table outlines the fees paid
on the unused portion of the facility (Facility Fee Rate) and letter of credit fees (Undrawn Letter of Credit Fee and Borrowing Spread)
depending on the rating levels of Tyson Foods, Inc. from S&P, Moody's and Fitch.
In the event the rating levels are split, the applicable fees and spread will be based upon the rating level in effect for two of the rating agencies,
or, if all three rating agencies have different rating levels, the applicable fees and spread will be based upon the rating level that is between the
rating levels of the other two rating agencies.
Debt Covenants
Our revolving credit facility contains affirmative and negative covenants that, among other things, may limit or restrict our ability to: create
liens and encumbrances; incur debt; merge, dissolve, liquidate or consolidate; make acquisitions and investments; dispose of or transfer assets;
change the nature of our business; engage in certain transactions with affiliates; and enter into hedging transactions, in each case, subject to
certain qualifications and exceptions. In addition, we are required to maintain minimum interest expense coverage and maximum debt to
capitalization ratios.
Our senior notes and term loans also contain affirmative and negative covenants that, among other things, may limit or restrict our ability to:
create liens; engage in certain sale/leaseback transactions; and engage in certain consolidations, mergers and sales of assets.
We were in compliance with all debt covenants at September 27, 2014 .
34
Ratings Level (S&P/Moody's/Fitch)
Facility Fee
Rate
Undrawn Letter of
Credit Fee and
Borrowing Spread
A-/A3/A- or above
0.100
%
1.000
%
BBB+/Baa1/BBB+
0.125
%
1.125
%
BBB/Baa2/BBB (current level)
0.150
%
1.250
%
BBB-/Baa3/BBB-
0.200
%
1.500
%
BB+/Ba1/BB+ or lower
0.250
%
1.750
%