Tyson Foods 2014 Annual Report Download - page 44
Download and view the complete annual report
Please find page 44 of the 2014 Tyson Foods annual report below. You can navigate through the pages in the report by either clicking on the pages listed below, or by using the keyword search tool below to find specific information within the annual report.-
 1
1 -
2
-
3
-
4
-
5
-
6
-
7
-
8
-
9
-
10
-
11
-
12
-
13
-
14
-
15
-
16
-
17
-
18
-
19
-
20
-
21
-
22
-
23
-
24
-
25
-
26
-
27
-
28
-
29
-
30
-
31
-
32
-
33
-
 34
34 -
 35
35 -
 36
36 -
 37
37 -
 38
38 -
 39
39 -
 40
40 -
 41
41 -
 42
42 -
 43
43 -
 44
44 -
 45
45 -
 46
46 -
 47
47 -
 48
48 -
 49
49 -
 50
50 -
 51
51 -
 52
52 -
 53
53 -
 54
54 -
55
-
56
-
57
-
58
-
59
-
60
-
61
-
62
-
63
-
64
-
65
-
66
-
67
-
68
-
69
-
70
-
71
-
72
-
73
-
74
-
75
-
76
-
77
-
78
-
79
-
80
-
81
-
82
-
83
-
84
-
85
-
86
-
87
-
88
-
89
-
90
-
91
-
92
-
93
-
94
-
95
-
96
-
97
-
98
-
99
-
100
-
101
-
102
-
103
-
104
-
105
-
106
-
107
-
108
-
109
-
110
-
111
-
112
-
113
-
114
-
115
-
116
-
117
-
118
-
119
-
120
-
121
-
122
-
123
-
124
-
125
-
126
-
127
-
128
-
129
-
130
-
131
-
132
-
133
-
134
-
135
-
136
-
137
-
138
-
139
-
140
-
141
-
142
-
143
-
144
-
145
-
146
-
147
-
148
-
149
-
150
-
151
-
152
-
153
-
154
-
155
-
156
-
157
-
158
-
159
-
160
-
161
-
162
-
163
-
164
-
165
-
166
-
167
-
168
-
169
-
170
-
171
-
172
-
173
-
174
-
175
-
176
-
177
-
178
-
179
-
180
-
181
-
182
-
183
-
184
-
185
-
186
-
187
-
188
-
189
-
190
-
191
-
192
-
193
-
194
-
195
-
196
-
197
-
198
-
199
-
200
-
201
-
202
-
203
-
204
-
205
-
206
-
207
-
208
-
209
-
210
-
211
-
212
-
213
-
214
-
215
-
216
-
217
-
218
-
219
-
220
-
221
-
222
-
223
-
224
-
225
-
226
-
227
-
228
 |
 |

39
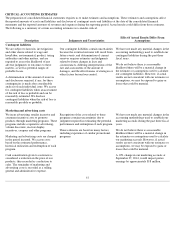
Description
Judgments and Uncertainties
Effect if Actual Results Differ From
Assumptions
Defined benefit pension plans
We sponsor nine defined benefit pension
plans that provide retirement benefits to
certain employees. We also participate in a
multi-employer plan that provides defined
benefits to certain employees covered by
collective bargaining agreements. Such plans
are usually administered by a board of
trustees composed of the management of the
participating companies and labor
representatives.
We use independent third-party actuaries to
assist us in determining our pension
obligations and net periodic benefit cost. We
and the actuaries review assumptions that
include estimates of the present value of the
projected future pension payment to all plan
participants, taking into consideration the
likelihood of potential future events such as
salary increases and demographic
experience. We accumulate and amortize the
effect of actuarial gains and losses over
future periods.
Net periodic benefit costs for the defined
benefit pension plans were $14 million in
2014. The projected benefit obligation was
$2,031 million at the end of fiscal 2014.
Unrecognized actuarial losses were $75
million at the end of fiscal 2014. We
currently expect net periodic benefit cost for
fiscal 2015 to be approximately $8 million.
Plan assets are currently comprised of
approximately 81% fixed income securities
and 12% equity securities. Fixed income
securities can include, but are not limited to,
direct bond investments and pooled or
indirect bond investments. Other
investments may include, but are not limited
to, international and domestic equities, real
estate, commodities and private equity.
We expect to contribute approximately $14
million of cash to our pension plans in fiscal
2015. The exact amount of cash
contributions made to pension plans in any
year is dependent upon a number of factors,
including minimum funding requirements.
Our defined benefit pension plans contain
uncertainties due to assumptions required and
judgments used.
The key assumptions used in developing the
required estimates include such factors as
discount rates, expected returns on plan assets,
retirement rates, and mortality.
These assumptions can have a material impact
upon the funded status and the net periodic
benefit cost.
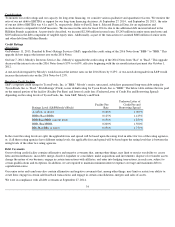
The discount rates were determined using a
cash flow matching technique whereby the
rates of a yield curve, developed from high-
quality debt securities, were applied to the
benefit obligations to determine the
appropriate discount rate. In determining the
long-term rate of return on plan assets, we
first examined historical rates of return for the
various asset classes within the plans. We then
determined a long-term projected rate-of-
return based on expected returns. Investment,
management and other fees paid out of plan
assets are factored into the determination of
asset return assumptions. Retirement rates are
based primarily on actual plan experience,
while standard actuarial tables are used to
estimate mortality.
It is reasonably likely that changes in external
factors will result in changes to the
assumptions used to measure pension
obligations and net periodic benefit cost in
future periods.
The risks of participating in multiemployer
plans are different from single-employer
plans. The net pension cost of the
multiemployer plans is equal to the annual
contribution determined in accordance with
the provisions of negotiated labor contracts.
Assets contributed to such plans are not
segregated or otherwise restricted to provide
benefits only to our employees. The future
cost of these plans is dependent on a number
of factors including the funded status of the
plans and the ability of the other participating
companies to meet ongoing funding
obligations.
We have not made any material changes in the
accounting methodology used to establish our
pension obligations and net periodic benefit
cost during the past three fiscal years.
We do not believe there is a reasonable
likelihood there will be a material change in
the estimates or assumptions used to calculate
our pension obligations and net periodic
benefit cost. However, if actual results are not
consistent with our estimates or assumptions,
they are accumulated and amortized over
future periods and, therefore generally affect
the net periodic benefit cost in future periods.
A 1% increase in the discount rate at
September 27, 2014, would result in an
decrease in the projected benefit obligation
and net periodic benefit cost of approximately
$246 million and $2 million, respectively. A
1% decrease in the discount rate at September
27, 2014, would result in an increase in the
projected benefit obligation and decrease in
net periodic benefit cost of approximately
$283 million and $1 million, respectively.
A 1% change in the return on plan assets at
September 27, 2014, would impact the net
periodic benefit cost by approximately $16
million.
The sensitivities reflect the impact of
changing one assumption at a time and are
specific to based conditions at the end of
2014. Economic factors and conditions often
effect multiple assumption simultaneously and
that the effect of changes in assumptions are
not necessarily linear.