Tyson Foods 2014 Annual Report Download - page 26
Download and view the complete annual report
Please find page 26 of the 2014 Tyson Foods annual report below. You can navigate through the pages in the report by either clicking on the pages listed below, or by using the keyword search tool below to find specific information within the annual report.-
 1
1 -
2
-
3
-
4
-
5
-
6
-
7
-
8
-
9
-
10
-
11
-
12
-
13
-
14
-
15
-
 16
16 -
 17
17 -
 18
18 -
 19
19 -
 20
20 -
 21
21 -
 22
22 -
 23
23 -
 24
24 -
 25
25 -
 26
26 -
 27
27 -
 28
28 -
 29
29 -
 30
30 -
 31
31 -
 32
32 -
 33
33 -
 34
34 -
 35
35 -
 36
36 -
37
-
38
-
39
-
40
-
41
-
42
-
43
-
44
-
45
-
46
-
47
-
48
-
49
-
50
-
51
-
52
-
53
-
54
-
55
-
56
-
57
-
58
-
59
-
60
-
61
-
62
-
63
-
64
-
65
-
66
-
67
-
68
-
69
-
70
-
71
-
72
-
73
-
74
-
75
-
76
-
77
-
78
-
79
-
80
-
81
-
82
-
83
-
84
-
85
-
86
-
87
-
88
-
89
-
90
-
91
-
92
-
93
-
94
-
95
-
96
-
97
-
98
-
99
-
100
-
101
-
102
-
103
-
104
-
105
-
106
-
107
-
108
-
109
-
110
-
111
-
112
-
113
-
114
-
115
-
116
-
117
-
118
-
119
-
120
-
121
-
122
-
123
-
124
-
125
-
126
-
127
-
128
-
129
-
130
-
131
-
132
-
133
-
134
-
135
-
136
-
137
-
138
-
139
-
140
-
141
-
142
-
143
-
144
-
145
-
146
-
147
-
148
-
149
-
150
-
151
-
152
-
153
-
154
-
155
-
156
-
157
-
158
-
159
-
160
-
161
-
162
-
163
-
164
-
165
-
166
-
167
-
168
-
169
-
170
-
171
-
172
-
173
-
174
-
175
-
176
-
177
-
178
-
179
-
180
-
181
-
182
-
183
-
184
-
185
-
186
-
187
-
188
-
189
-
190
-
191
-
192
-
193
-
194
-
195
-
196
-
197
-
198
-
199
-
200
-
201
-
202
-
203
-
204
-
205
-
206
-
207
-
208
-
209
-
210
-
211
-
212
-
213
-
214
-
215
-
216
-
217
-
218
-
219
-
220
-
221
-
222
-
223
-
224
-
225
-
226
-
227
-
228
 |
 |

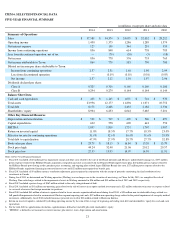
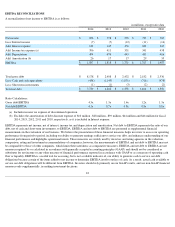
ITEM 7. MANAGEMENT’S DISCUSSION AND ANALYSIS OF FINANCIAL CONDITION AND RESULTS OF OPERATIONS
DESCRIPTION OF THE COMPANY
We are one of the world's largest producers of chicken, beef, pork and prepared foods that include leading brands such as Tyson®, Jimmy
Dean®, Hillshire Farm®, Sara Lee® frozen bakery, Ball Park®, Wright®, Aidells® and State Fair®. Some of the key factors influencing our
business are customer demand for our products; the ability to maintain and grow relationships with customers and introduce new and
innovative products to the marketplace; accessibility of international markets; market prices for our products; the cost and availability of live
cattle and hogs, raw materials, and feed ingredients; and operating efficiencies of our facilities.
Our operations are conducted in five segments: Chicken, Beef, Pork, Prepared Foods and International. Our International segment became a
separate reportable segment in the second quarter of fiscal 2014 as a result of changes to our internal financial reporting to align with
previously announced executive leadership changes. The International segment includes our foreign operations primarily related to raising and
processing live chickens into fresh, frozen and value-added chicken products in Brazil, China, India and Mexico. All periods presented have
been reclassified to reflect this change. Beef, Pork, Prepared Foods and Other results were not impacted by this change.
On August 28, 2014, we acquired and consolidated The Hillshire Brands Company ("Hillshire Brands"), a manufacturer and marketer of
branded, convenient foods. Hillshire Brands' one month results from operations for fiscal 2014 are included in the Prepared Foods segment.
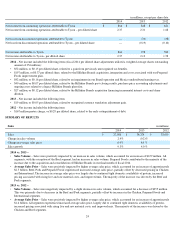
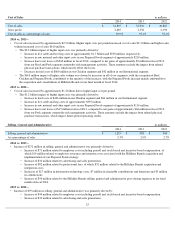
OVERVIEW
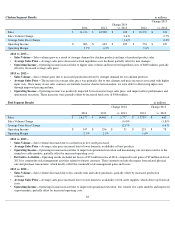
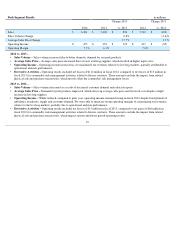
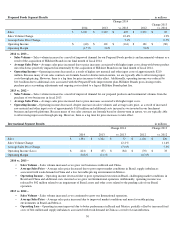
Margins – Our total operating margin was 3.8% in fiscal 2014 . Operating margins by segment were as follows:
23
•
General – Operating income grew 4% in fiscal 2014 over fiscal 2013, which was led by record earnings in our Chicken segment and
strong performance in our Beef and Pork segments. Revenues increased 9% to a record $37.6 billion, driven by price and mix
improvements. We were able to overcome a $2.3 billion increase in input costs through strong operational execution and margin
management. We continued to execute our strategy of accelerating growth in domestic value-added chicken sales, prepared food sales,
innovating products, services and customer insights and cultivating our talent development to support Tyson's growth for the future.
• Market environment – Our Chicken segment delivered record results in fiscal 2014 driven by strong demand and favorable domestic
market conditions. Our Beef segment experienced higher fed cattle costs and reduced availability of fed cattle supplies but delivered
strong results by maximizing our revenues relative to the rising costs experienced in the live cattle markets. The Pork segment's
operating margins remained within its normalized range due to favorable market conditions associated with lower pork supplies.
Our Prepared Foods segment was challenged by rapidly increasing raw material prices in addition to costs incurred as we continue
to execute our Prepared Foods strategy. Our International segment experienced higher volumes, offset with lower average sales
prices due to weak demand of chicken in our foreign operations.
• Chicken – 7.9%
• Beef – 2.1%
• Pork –
7.2%
• Prepared Foods – (
1.5)%
• International - (
8.8)%
• Liquidity – During fiscal 2014 , we generated $1.2 billion of operating cash flows. We repurchased 7.1 million shares of our Class A
common stock for $250 million under our share repurchase program in fiscal 2014 . At September 27, 2014 , we had $1.6 billion of
liquidity, which includes the availability under our credit facility and $438 million of cash and cash equivalents.
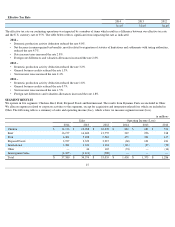
• Our accounting cycle resulted in a 52-
week year for fiscal 2014, 2013 and 2012.