Tyson Foods 2014 Annual Report Download - page 49
Download and view the complete annual report
Please find page 49 of the 2014 Tyson Foods annual report below. You can navigate through the pages in the report by either clicking on the pages listed below, or by using the keyword search tool below to find specific information within the annual report.-
 1
1 -
2
-
3
-
4
-
5
-
6
-
7
-
8
-
9
-
10
-
11
-
12
-
13
-
14
-
15
-
16
-
17
-
18
-
19
-
20
-
21
-
22
-
23
-
24
-
25
-
26
-
27
-
28
-
29
-
30
-
31
-
32
-
33
-
34
-
35
-
36
-
37
-
38
-
 39
39 -
 40
40 -
 41
41 -
 42
42 -
 43
43 -
 44
44 -
 45
45 -
 46
46 -
 47
47 -
 48
48 -
 49
49 -
 50
50 -
 51
51 -
 52
52 -
 53
53 -
 54
54 -
 55
55 -
 56
56 -
 57
57 -
 58
58 -
 59
59 -
60
-
61
-
62
-
63
-
64
-
65
-
66
-
67
-
68
-
69
-
70
-
71
-
72
-
73
-
74
-
75
-
76
-
77
-
78
-
79
-
80
-
81
-
82
-
83
-
84
-
85
-
86
-
87
-
88
-
89
-
90
-
91
-
92
-
93
-
94
-
95
-
96
-
97
-
98
-
99
-
100
-
101
-
102
-
103
-
104
-
105
-
106
-
107
-
108
-
109
-
110
-
111
-
112
-
113
-
114
-
115
-
116
-
117
-
118
-
119
-
120
-
121
-
122
-
123
-
124
-
125
-
126
-
127
-
128
-
129
-
130
-
131
-
132
-
133
-
134
-
135
-
136
-
137
-
138
-
139
-
140
-
141
-
142
-
143
-
144
-
145
-
146
-
147
-
148
-
149
-
150
-
151
-
152
-
153
-
154
-
155
-
156
-
157
-
158
-
159
-
160
-
161
-
162
-
163
-
164
-
165
-
166
-
167
-
168
-
169
-
170
-
171
-
172
-
173
-
174
-
175
-
176
-
177
-
178
-
179
-
180
-
181
-
182
-
183
-
184
-
185
-
186
-
187
-
188
-
189
-
190
-
191
-
192
-
193
-
194
-
195
-
196
-
197
-
198
-
199
-
200
-
201
-
202
-
203
-
204
-
205
-
206
-
207
-
208
-
209
-
210
-
211
-
212
-
213
-
214
-
215
-
216
-
217
-
218
-
219
-
220
-
221
-
222
-
223
-
224
-
225
-
226
-
227
-
228
 |
 |

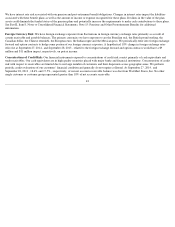
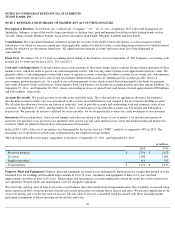
We have interest rate risk associated with our pension and post-retirement benefit obligations. Changes in interest rates impact the liabilities
associated with these benefit plans as well as the amount of income or expense recognized for these plans. Declines in the value of the plan
assets could diminish the funded status of the pension plans and potentially increase the requirements to make cash contributions to these plans.
See Part II, Item 8, Notes to Consolidated Financial Statements, Note 15: Pensions and Other Postretirement Benefits for additional
information.
Foreign Currency Risk: We have foreign exchange exposure from fluctuations in foreign currency exchange rates primarily as a result of
certain receivable and payable balances. The primary currencies we have exposure to are the Brazilian real, the British pound sterling, the
Canadian dollar, the Chinese renminbi, the European euro, the Indian rupee and the Mexican peso. We periodically enter into foreign exchange
forward and option contracts to hedge some portion of our foreign currency exposure. A hypothetical 10% change in foreign exchange rates
effective at September 27, 2014 , and September 28, 2013 , related to the foreign exchange forward and option contracts would have a $9
million and $11 million impact, respectively, on pretax income.
Concentrations of Credit Risk: Our financial instruments exposed to concentrations of credit risk consist primarily of cash equivalents and
trade receivables. Our cash equivalents are in high quality securities placed with major banks and financial institutions. Concentrations of credit
risk with respect to receivables are limited due to our large number of customers and their dispersion across geographic areas. We perform
periodic credit evaluations of our customers’ financial condition and generally do not require collateral. At September 27, 2014 , and
September 28, 2013 , 18.6% and 17.5% , respectively, of our net accounts receivable balance was due from Wal-Mart Stores, Inc. No other
single customer or customer group represented greater than 10% of net accounts receivable.
43