Tyson Foods 2014 Annual Report Download - page 27
Download and view the complete annual report
Please find page 27 of the 2014 Tyson Foods annual report below. You can navigate through the pages in the report by either clicking on the pages listed below, or by using the keyword search tool below to find specific information within the annual report.-
 1
1 -
2
-
3
-
4
-
5
-
6
-
7
-
8
-
9
-
10
-
11
-
12
-
13
-
14
-
15
-
16
-
 17
17 -
 18
18 -
 19
19 -
 20
20 -
 21
21 -
 22
22 -
 23
23 -
 24
24 -
 25
25 -
 26
26 -
 27
27 -
 28
28 -
 29
29 -
 30
30 -
 31
31 -
 32
32 -
 33
33 -
 34
34 -
 35
35 -
 36
36 -
 37
37 -
38
-
39
-
40
-
41
-
42
-
43
-
44
-
45
-
46
-
47
-
48
-
49
-
50
-
51
-
52
-
53
-
54
-
55
-
56
-
57
-
58
-
59
-
60
-
61
-
62
-
63
-
64
-
65
-
66
-
67
-
68
-
69
-
70
-
71
-
72
-
73
-
74
-
75
-
76
-
77
-
78
-
79
-
80
-
81
-
82
-
83
-
84
-
85
-
86
-
87
-
88
-
89
-
90
-
91
-
92
-
93
-
94
-
95
-
96
-
97
-
98
-
99
-
100
-
101
-
102
-
103
-
104
-
105
-
106
-
107
-
108
-
109
-
110
-
111
-
112
-
113
-
114
-
115
-
116
-
117
-
118
-
119
-
120
-
121
-
122
-
123
-
124
-
125
-
126
-
127
-
128
-
129
-
130
-
131
-
132
-
133
-
134
-
135
-
136
-
137
-
138
-
139
-
140
-
141
-
142
-
143
-
144
-
145
-
146
-
147
-
148
-
149
-
150
-
151
-
152
-
153
-
154
-
155
-
156
-
157
-
158
-
159
-
160
-
161
-
162
-
163
-
164
-
165
-
166
-
167
-
168
-
169
-
170
-
171
-
172
-
173
-
174
-
175
-
176
-
177
-
178
-
179
-
180
-
181
-
182
-
183
-
184
-
185
-
186
-
187
-
188
-
189
-
190
-
191
-
192
-
193
-
194
-
195
-
196
-
197
-
198
-
199
-
200
-
201
-
202
-
203
-
204
-
205
-
206
-
207
-
208
-
209
-
210
-
211
-
212
-
213
-
214
-
215
-
216
-
217
-
218
-
219
-
220
-
221
-
222
-
223
-
224
-
225
-
226
-
227
-
228
 |
 |

2014 – Net income included the following items (fiscal 2014 per diluted share adjustments utilized a weighted average shares outstanding
amount of 356 million):
2013 – Net income included the following item:
2012 – Net income included the following item:
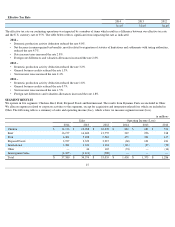
SUMMARY OF RESULTS
2014 vs. 2013 –
2013 vs. 2012 –
24
in millions, except per share data
2014
2013
2012
Net income from continuing operations attributable to Tyson
$
864
$
848
$
621
Net income from continuing operations attributable to Tyson – per diluted share
2.37
2.31
1.68
Net loss from discontinued operation attributable to Tyson
—
(
70
)
(38
)
Net loss from discontinued operation attributable to Tyson – per diluted share
—
(
0.19
)
(0.10
)
Net income attributable to Tyson
864
778
583
Net income attributable to Tyson - per diluted share
2.37
2.12
1.58
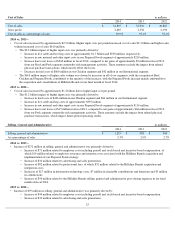
• $
52 million, or $0.15 per diluted share, related to a gain from previously unrecognized tax benefits.
• $197 million, or $0.37 per diluted share, related to the Hillshire Brands acquisition, integration and costs associated with our Prepared
Foods improvement plan.
• $
42 million, or $0.16 per diluted share, related to an impairment in our Brazil operation and Mexico undistributed earnings tax.
• $40 million, or $0.07 per diluted share, related to the Hillshire Brands post-closing results, purchase price accounting adjustments and
ongoing costs related to a legacy Hillshire Brands plant fire.
• $27 million, or $0.12 per diluted share, related to the Hillshire Brands acquisition financing incremental interest costs and share
dilution.
• $
19 million, or $0.05 per diluted share, related to recognized currency translation adjustment gain.
• $
167 million pretax charge, or $0.29 per diluted share, related to the early extinguishment of debt.
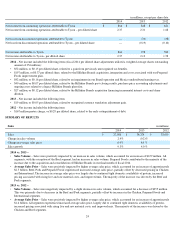
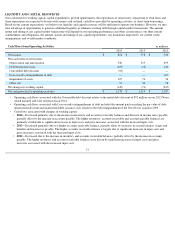
Sales
in millions
2014
2013
2012
Sales
$
37,580
$
34,374
$
33,055
Change in sales volume
2.4
%
(0.2
)%
Change in average sales price
6.9
%
4.6
%
Sales growth
9.3
%
4.0
%
• Sales Volume – Sales were positively impacted by an increase in sales volume, which accounted for an increase of $679 million. All
segments, with the exception of the Beef segment, had an increase in sales volume. Prepared Foods contributed to the majority of the
increase due to the acquisition and consolidation of Hillshire Brands in our final month of fiscal 2014.
• Average Sales Price – Sales were positively impacted by higher average sales price, which accounted for an increase of approximately
$2.5 billion. Beef, Pork and Prepared Foods experienced increased average sales price, partially offset by decreased pricing in Chicken
and International. The increase in average sales price was largely due to continued tight domestic availability of protein, increased
pricing associated with rising live and raw material costs, and improved mix. The majority of the increase was driven by the Beef and
Pork segments.
• Sales Volume – Sales were negatively impacted by a slight decrease in sales volume, which accounted for a decrease of $255 million.
This was primarily due to decreases in the Beef and Pork segments, partially offset by increases in the Chicken, Prepared Foods and
International segments.
• Average Sales Price – Sales were positively impacted by higher average sales price, which accounted for an increase of approximately
$1.6 billion. All segments experienced increased average sales price, largely due to continued tight domestic availability of protein,
increased pricing associated with rising live and raw material costs, and improved mix. The majority of the increase was driven by the
Chicken and Beef segments.