Tyson Foods 2014 Annual Report Download - page 100
Download and view the complete annual report
Please find page 100 of the 2014 Tyson Foods annual report below. You can navigate through the pages in the report by either clicking on the pages listed below, or by using the keyword search tool below to find specific information within the annual report.-
 1
1 -
2
-
3
-
4
-
5
-
6
-
7
-
8
-
9
-
10
-
11
-
12
-
13
-
14
-
15
-
16
-
17
-
18
-
19
-
20
-
21
-
22
-
23
-
24
-
25
-
26
-
27
-
28
-
29
-
30
-
31
-
32
-
33
-
34
-
35
-
36
-
37
-
38
-
39
-
40
-
41
-
42
-
43
-
44
-
45
-
46
-
47
-
48
-
49
-
50
-
51
-
52
-
53
-
54
-
55
-
56
-
57
-
58
-
59
-
60
-
61
-
62
-
63
-
64
-
65
-
66
-
67
-
68
-
69
-
70
-
71
-
72
-
73
-
74
-
75
-
76
-
77
-
78
-
79
-
80
-
81
-
82
-
83
-
84
-
85
-
86
-
87
-
88
-
89
-
 90
90 -
 91
91 -
 92
92 -
 93
93 -
 94
94 -
 95
95 -
 96
96 -
 97
97 -
 98
98 -
 99
99 -
 100
100 -
 101
101 -
 102
102 -
 103
103 -
 104
104 -
 105
105 -
 106
106 -
 107
107 -
 108
108 -
 109
109 -
 110
110 -
111
-
112
-
113
-
114
-
115
-
116
-
117
-
118
-
119
-
120
-
121
-
122
-
123
-
124
-
125
-
126
-
127
-
128
-
129
-
130
-
131
-
132
-
133
-
134
-
135
-
136
-
137
-
138
-
139
-
140
-
141
-
142
-
143
-
144
-
145
-
146
-
147
-
148
-
149
-
150
-
151
-
152
-
153
-
154
-
155
-
156
-
157
-
158
-
159
-
160
-
161
-
162
-
163
-
164
-
165
-
166
-
167
-
168
-
169
-
170
-
171
-
172
-
173
-
174
-
175
-
176
-
177
-
178
-
179
-
180
-
181
-
182
-
183
-
184
-
185
-
186
-
187
-
188
-
189
-
190
-
191
-
192
-
193
-
194
-
195
-
196
-
197
-
198
-
199
-
200
-
201
-
202
-
203
-
204
-
205
-
206
-
207
-
208
-
209
-
210
-
211
-
212
-
213
-
214
-
215
-
216
-
217
-
218
-
219
-
220
-
221
-
222
-
223
-
224
-
225
-
226
-
227
-
228
 |
 |
91
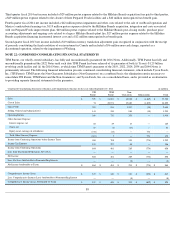
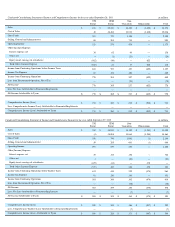
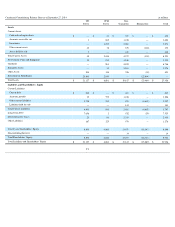
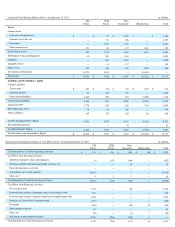
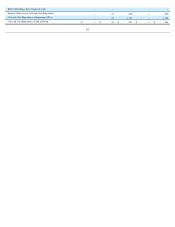
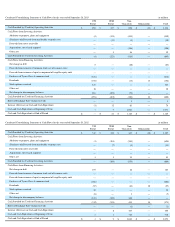
Condensed Consolidating Balance Sheet as of September 27, 2014
in millions
TFI
Parent
TFM
Parent
Non-
Guarantors
Eliminations
Total
Assets
Current Assets:
Cash and cash equivalents
$
—
$
41
$
397
$
—
$
438
Accounts receivable, net
3
665
1,016
—
1,684
Inventories —
1,272
2,002
—
3,274
Other current assets
42
78
379
(120
)
379
Assets held for sale
3
—
443
—
446
Total Current Assets
48
2,056
4,237
(120
)
6,221
Net Property, Plant and Equipment
30
932
4,168
—
5,130
Goodwill —
881
5,825
—
6,706
Intangible Assets —
15
5,261
—
5,276
Other Assets
204
148
326
(55
)
623
Investment in Subsidiaries
20,845
2,049
—
(
22,894
)
—
Total Assets
$
21,127
$
6,081
$
19,817
$
(23,069
)
$
23,956
Liabilities and Shareholders’ Equity
Current Liabilities:
Current debt
$
240
$
—
$
403
$
—
$
643
Accounts payable
35
755
1,016
—
1,806
Other current liabilities
4,718
235
921
(4,667
)
1,207
Liabilities held for sale —
—
141
—
141
Total Current Liabilities
4,993
990
2,481
(4,667
)
3,797
Long-Term Debt
7,056
2
532
(55
)
7,535
Deferred Income Taxes
21
96
2,333
—
2,450
Other Liabilities
167
125
978
—
1,270
Total Tyson Shareholders’ Equity
8,890
4,868
13,479
(18,347
)
8,890
Noncontrolling Interests —
—
14
—
14
Total Shareholders’ Equity
8,890
4,868
13,493
(18,347
)
8,904
Total Liabilities and Shareholders’ Equity
$
21,127
$
6,081
$
19,817
$
(23,069
)
$
23,956