Tyson Foods 2014 Annual Report Download - page 34
Download and view the complete annual report
Please find page 34 of the 2014 Tyson Foods annual report below. You can navigate through the pages in the report by either clicking on the pages listed below, or by using the keyword search tool below to find specific information within the annual report.-
 1
1 -
2
-
3
-
4
-
5
-
6
-
7
-
8
-
9
-
10
-
11
-
12
-
13
-
14
-
15
-
16
-
17
-
18
-
19
-
20
-
21
-
22
-
23
-
 24
24 -
 25
25 -
 26
26 -
 27
27 -
 28
28 -
 29
29 -
 30
30 -
 31
31 -
 32
32 -
 33
33 -
 34
34 -
 35
35 -
 36
36 -
 37
37 -
 38
38 -
 39
39 -
 40
40 -
 41
41 -
 42
42 -
 43
43 -
 44
44 -
45
-
46
-
47
-
48
-
49
-
50
-
51
-
52
-
53
-
54
-
55
-
56
-
57
-
58
-
59
-
60
-
61
-
62
-
63
-
64
-
65
-
66
-
67
-
68
-
69
-
70
-
71
-
72
-
73
-
74
-
75
-
76
-
77
-
78
-
79
-
80
-
81
-
82
-
83
-
84
-
85
-
86
-
87
-
88
-
89
-
90
-
91
-
92
-
93
-
94
-
95
-
96
-
97
-
98
-
99
-
100
-
101
-
102
-
103
-
104
-
105
-
106
-
107
-
108
-
109
-
110
-
111
-
112
-
113
-
114
-
115
-
116
-
117
-
118
-
119
-
120
-
121
-
122
-
123
-
124
-
125
-
126
-
127
-
128
-
129
-
130
-
131
-
132
-
133
-
134
-
135
-
136
-
137
-
138
-
139
-
140
-
141
-
142
-
143
-
144
-
145
-
146
-
147
-
148
-
149
-
150
-
151
-
152
-
153
-
154
-
155
-
156
-
157
-
158
-
159
-
160
-
161
-
162
-
163
-
164
-
165
-
166
-
167
-
168
-
169
-
170
-
171
-
172
-
173
-
174
-
175
-
176
-
177
-
178
-
179
-
180
-
181
-
182
-
183
-
184
-
185
-
186
-
187
-
188
-
189
-
190
-
191
-
192
-
193
-
194
-
195
-
196
-
197
-
198
-
199
-
200
-
201
-
202
-
203
-
204
-
205
-
206
-
207
-
208
-
209
-
210
-
211
-
212
-
213
-
214
-
215
-
216
-
217
-
218
-
219
-
220
-
221
-
222
-
223
-
224
-
225
-
226
-
227
-
228
 |
 |

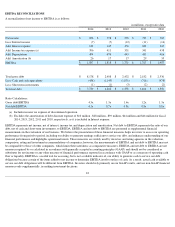
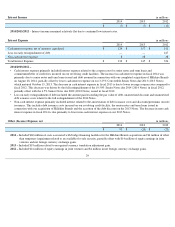
2014 vs. 2013 –
2013 vs. 2012 –
2014 vs. 2013 –
2013 vs. 2012 –
30
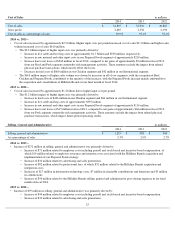
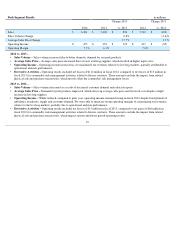
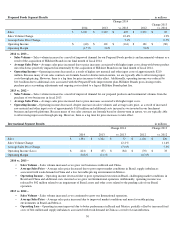
Prepared Foods Segment Results
in millions
2014
2013
Change 2014
vs. 2013
2012
Change 2013
vs. 2012
Sales
$
3,927
$
3,322
$
605
$
3,237
$
85
Sales Volume Change
10.4
%
1.9
%
Average Sales Price Change
7.1
%
0.7
%
Operating Income
$
(60
)
$
101
$
(161
)
$
181
$
(80
)
Operating Margin
(1.5
)%
3.0
%
5.6
%
• Sales Volume –
Sales volume increased as a result of improved demand for our Prepared Foods products and incremental volumes as a
result of the acquisition of Hillshire Brands in our final month of fiscal 2014.
• Average Sales Price –
Average sales price increased due to price increases associated with higher input costs along with better product
mix which was positively impacted incrementally by the acquisition of Hillshire Brands in our final month of fiscal 2014.
• Operating Income – Operating income decreased as a result of higher raw material and other input costs of approximately $210
million. Because many of our sales contracts are formula based or shorter-term in nature, we are typically able to offset rising input
costs through pricing. However, there is a lag time for price increases to take effect. Additionally, operating income was reduced by
$113 million due to additional costs associated with the Prepared Foods improvement plan, Hillshire Brands post-closing results,
purchase price accounting adjustments and ongoing costs related to a legacy Hillshire Brands plant fire.
• Sales Volume – Sales volume increased as a result of improved demand for our prepared products and incremental volumes from the
purchase of two businesses in fiscal 2013.
• Average Sales Price –
Average sales price increased due to price increases associated with higher input costs.
• Operating Income – Operating income decreased, despite increases in sales volumes and average sales price, as a result of increased
raw material and other input costs of approximately $110 million and additional costs incurred as we invested in our lunchmeat
business and growth platforms. Because many of our sales contracts are formula based or shorter-term in nature, we are typically able
to offset rising input costs through pricing. However, there is a lag time for price increases to take effect.
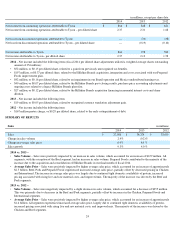
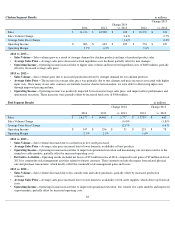
International Segment Results
in millions
2014
2013
Change 2014
vs. 2013
2012
Change 2013
vs. 2012
Sales
$
1,381
$
1,324
$
57
$
1,104
$
220
Sales Volume Change
12.2
%
11.6
%
Average Sales Price Change
(7.0
)%
7.5
%
Operating Income (Loss)
$
(121
)
$
(37
)
$
(84
)
$
(70
)
$
33
Operating Margin
(8.8
)%
(2.8
)%
(6.3
)%
• Sales Volume –
Sales volume increased as we grew our businesses in Brazil and China.
• Average Sales Price – Average sales price decreased due to poor export market conditions in Brazil, supply imbalances
associated with weak demand in China and a less favorable pricing environment in Mexico.
• Operating Income – Operating income decreased due to poor operational execution in Brazil, challenging market conditions in
Brazil and China and additional costs incurred as we grew our International operation. Additionally, operating income was
reduced by $42 million related to an impairment of Brazil assets and other costs related to the pending sale of our Brazil
operation.
• Sales Volume –
Sales volume increased as we continued to grow our International operation.
• Average Sales Price – Average sales price increased due to improved market conditions and more favorable pricing
environments in Brazil and Mexico.
• Operating Loss – Operating income improved due to better performance in Brazil and Mexico, partially offset by increased feed
costs of $64 million and supply imbalances associated with weak demand in China as a result of avian influenza.