Tyson Foods 2014 Annual Report Download - page 70
Download and view the complete annual report
Please find page 70 of the 2014 Tyson Foods annual report below. You can navigate through the pages in the report by either clicking on the pages listed below, or by using the keyword search tool below to find specific information within the annual report.-
 1
1 -
2
-
3
-
4
-
5
-
6
-
7
-
8
-
9
-
10
-
11
-
12
-
13
-
14
-
15
-
16
-
17
-
18
-
19
-
20
-
21
-
22
-
23
-
24
-
25
-
26
-
27
-
28
-
29
-
30
-
31
-
32
-
33
-
34
-
35
-
36
-
37
-
38
-
39
-
40
-
41
-
42
-
43
-
44
-
45
-
46
-
47
-
48
-
49
-
50
-
51
-
52
-
53
-
54
-
55
-
56
-
57
-
58
-
59
-
 60
60 -
 61
61 -
 62
62 -
 63
63 -
 64
64 -
 65
65 -
 66
66 -
 67
67 -
 68
68 -
 69
69 -
 70
70 -
 71
71 -
 72
72 -
 73
73 -
 74
74 -
 75
75 -
 76
76 -
 77
77 -
 78
78 -
 79
79 -
 80
80 -
81
-
82
-
83
-
84
-
85
-
86
-
87
-
88
-
89
-
90
-
91
-
92
-
93
-
94
-
95
-
96
-
97
-
98
-
99
-
100
-
101
-
102
-
103
-
104
-
105
-
106
-
107
-
108
-
109
-
110
-
111
-
112
-
113
-
114
-
115
-
116
-
117
-
118
-
119
-
120
-
121
-
122
-
123
-
124
-
125
-
126
-
127
-
128
-
129
-
130
-
131
-
132
-
133
-
134
-
135
-
136
-
137
-
138
-
139
-
140
-
141
-
142
-
143
-
144
-
145
-
146
-
147
-
148
-
149
-
150
-
151
-
152
-
153
-
154
-
155
-
156
-
157
-
158
-
159
-
160
-
161
-
162
-
163
-
164
-
165
-
166
-
167
-
168
-
169
-
170
-
171
-
172
-
173
-
174
-
175
-
176
-
177
-
178
-
179
-
180
-
181
-
182
-
183
-
184
-
185
-
186
-
187
-
188
-
189
-
190
-
191
-
192
-
193
-
194
-
195
-
196
-
197
-
198
-
199
-
200
-
201
-
202
-
203
-
204
-
205
-
206
-
207
-
208
-
209
-
210
-
211
-
212
-
213
-
214
-
215
-
216
-
217
-
218
-
219
-
220
-
221
-
222
-
223
-
224
-
225
-
226
-
227
-
228
 |
 |

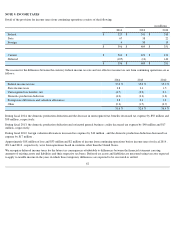
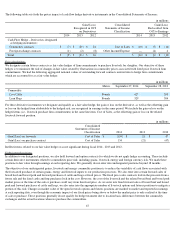
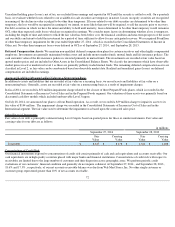
NOTE 9: INCOME TAXES
Detail of the provision for income taxes from continuing operations consists of the following:
The reasons for the difference between the statutory federal income tax rate and our effective income tax rate from continuing operations are as
follows:
During fiscal 2014, the domestic production deduction and the decrease in unrecognized tax benefits decreased tax expense by $50 million and
$58 million , respectively.
During fiscal 2013, the domestic production deduction and estimated general business credits decreased tax expense by $40 million and $17
million , respectively.
During fiscal 2012, foreign valuation allowances increased tax expense by $10 million , and the domestic production deduction decreased tax
expense by $17 million .
Approximately $18 million of loss and $53 million and $2 million of income from continuing operations before income taxes for fiscal 2014 ,
2013 and 2012 , respectively, were from operations based in countries other than the United States.
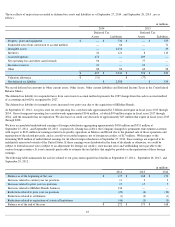
We recognize deferred income taxes for the future tax consequences attributable to differences between the financial statement carrying
amounts of existing assets and liabilities and their respective tax bases. Deferred tax assets and liabilities are measured using tax rates expected
to apply to taxable income in the years in which those temporary differences are expected to be recovered or settled.
62
in millions
2014
2013
2012
Federal
$
325
$
341
$
310
State
67
38
22
Foreign
4
30
19
$
396
$
409
$
351
Current
$
501
$
421
$
211
Deferred
(105
)
(12
)
140
$
396
$
409
$
351
2014
2013
2012
Federal income tax rate
35.0
%
35.0
%
35.0
%
State income taxes
2.8
2.4
1.5
Unrecognized tax benefits, net
(4.7
)
(0.2
)
0.6
Domestic production deduction
(4.0
)
(3.2
)
(1.8
)
Foreign rate differences and valuation allowances
2.8
0.3
1.8
Other
(0.3
)
(1.7
)
(0.7
)
31.6
%
32.6
%
36.4
%