Tyson Foods 2014 Annual Report Download - page 23
Download and view the complete annual report
Please find page 23 of the 2014 Tyson Foods annual report below. You can navigate through the pages in the report by either clicking on the pages listed below, or by using the keyword search tool below to find specific information within the annual report.-
 1
1 -
2
-
3
-
4
-
5
-
6
-
7
-
8
-
9
-
10
-
11
-
12
-
 13
13 -
 14
14 -
 15
15 -
 16
16 -
 17
17 -
 18
18 -
 19
19 -
 20
20 -
 21
21 -
 22
22 -
 23
23 -
 24
24 -
 25
25 -
 26
26 -
 27
27 -
 28
28 -
 29
29 -
 30
30 -
 31
31 -
 32
32 -
 33
33 -
34
-
35
-
36
-
37
-
38
-
39
-
40
-
41
-
42
-
43
-
44
-
45
-
46
-
47
-
48
-
49
-
50
-
51
-
52
-
53
-
54
-
55
-
56
-
57
-
58
-
59
-
60
-
61
-
62
-
63
-
64
-
65
-
66
-
67
-
68
-
69
-
70
-
71
-
72
-
73
-
74
-
75
-
76
-
77
-
78
-
79
-
80
-
81
-
82
-
83
-
84
-
85
-
86
-
87
-
88
-
89
-
90
-
91
-
92
-
93
-
94
-
95
-
96
-
97
-
98
-
99
-
100
-
101
-
102
-
103
-
104
-
105
-
106
-
107
-
108
-
109
-
110
-
111
-
112
-
113
-
114
-
115
-
116
-
117
-
118
-
119
-
120
-
121
-
122
-
123
-
124
-
125
-
126
-
127
-
128
-
129
-
130
-
131
-
132
-
133
-
134
-
135
-
136
-
137
-
138
-
139
-
140
-
141
-
142
-
143
-
144
-
145
-
146
-
147
-
148
-
149
-
150
-
151
-
152
-
153
-
154
-
155
-
156
-
157
-
158
-
159
-
160
-
161
-
162
-
163
-
164
-
165
-
166
-
167
-
168
-
169
-
170
-
171
-
172
-
173
-
174
-
175
-
176
-
177
-
178
-
179
-
180
-
181
-
182
-
183
-
184
-
185
-
186
-
187
-
188
-
189
-
190
-
191
-
192
-
193
-
194
-
195
-
196
-
197
-
198
-
199
-
200
-
201
-
202
-
203
-
204
-
205
-
206
-
207
-
208
-
209
-
210
-
211
-
212
-
213
-
214
-
215
-
216
-
217
-
218
-
219
-
220
-
221
-
222
-
223
-
224
-
225
-
226
-
227
-
228
 |
 |

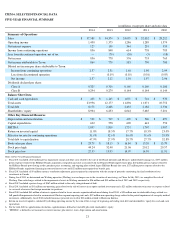
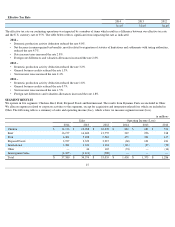
ITEM 6. SELECTED FINANCIAL DATA
FIVE-YEAR FINANCIAL SUMMARY
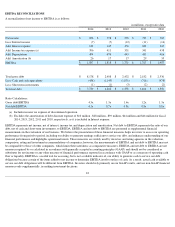
Notes to Five
-Year Financial Summary
21
in millions, except per share and ratio data
2014
2013
2012
2011
2010
Summary of Operations
Sales
$
37,580
$
34,374
$
33,055
$
32,032
$
28,212
Operating income
1,430
1,375
1,286
1,289
1,574
Net interest expense
125
138
344
231
333
Income from continuing operations
856
848
614
738
783
Loss from discontinued operation, net of tax
—
(
70
)
(38
)
(5
)
(18
)
Net income
856
778
576
733
765
Net income attributable to Tyson
864
778
583
750
780
Diluted net income per share attributable to Tyson:
Income from continuing operations
2.37
2.31
1.68
1.98
2.09
Loss from discontinued operation
—
(
0.19
)
(0.10
)
(0.01
)
(0.03
)
Net income
2.37
2.12
1.58
1.97
2.06
Dividends declared per share:
Class A
0.325
0.310
0.160
0.160
0.160
Class B
0.294
0.279
0.144
0.144
0.144
Balance Sheet Data
Cash and cash equivalents
$
438
$
1,145
$
1,071
$
716
$
978
Total assets
23,956
12,177
11,896
11,071
10,752
Total debt
8,178
2,408
2,432
2,182
2,536
Shareholders’ equity
8,904
6,233
6,042
5,685
5,201
Other Key Financial Measures
Depreciation and amortization
$
530
$
519
$
499
$
506
$
497
Capital expenditures
632
558
690
643
550
EBITDA
1,897
1,818
1,731
1,767
1,987
Return on invested capital
11.8
%
18.5
%
17.7
%
18.5
%
23.0
%
Effective tax rate for continuing operations
31.6
%
32.6
%
36.4
%
31.6
%
35.9
%
Total debt to capitalization
47.9
%
27.9
%
28.7
%
27.7
%
32.8
%
Book value per share
$
23.70
$
18.13
$
16.84
$
15.38
$
13.78
Stock price high
44.24
32.40
21.06
20.12
20.57
Stock price low
27.33
15.93
14.07
14.59
11.91
a. Fiscal 2014 included a $42 million pretax impairment charge and other costs related to the sale of our Brazil operation and Mexico's undistributed earnings tax, $197 million
pretax expense related to the Hillshire Brands acquisition, integration and costs associated with our Prepared Foods improvement plan, $40 million pretax expense related to
the Hillshire Brands post-closing results, purchase price accounting, and ongoing plant related legacy Hillshire Brands fire costs, $27 million pretax expense related to the
Hillshire Brands acquisition financing incremental interest cost and $52 million unrecognized tax benefit gain.
b. Fiscal 2013 included a $19 million currency translation adjustment gain recognized in conjunction with the receipt of proceeds constituting the final resolution of our
investment in Canada.
c. During fiscal 2013 we determined our Weifang operation (Weifang) was no longer core to the execution of our strategy in China. In July 2013, we completed the sale of
Weifang. Non-cash charges related to the impairment of assets in Weifang amounted to $56 million and $15 million in fiscal 2013 and 2012, respectively.
d.
Fiscal 2012 included a pretax charge of $167 million related to the early extinguishment of debt.
e. Fiscal 2011 included an $11 million non-
operating gain related to the sale of interest in an equity method investment and a $21 million reduction to income tax expense related
to a reversal of reserves for foreign uncertain tax positions.
f. Fiscal 2010 included $61 million of interest expense related to losses on notes repurchased/redeemed during fiscal 2010, a $29 million non-tax deductible charge related to a
full goodwill impairment related to an immaterial Chicken segment reporting unit and a $12 million non-
operating charge related to the partial impairment of an equity method
investment. Additionally, fiscal 2010 included insurance proceeds received of $38 million related to Hurricane Katrina.
g. Return on invested capital is calculated by dividing operating income by the sum of the average of beginning and ending total debt and shareholders’ equity less cash and cash
equivalents.
h. For the total debt to capitalization calculation, capitalization is defined as total debt plus total shareholders’
equity.
i.
"EBITDA" is defined as net income less interest income, plus interest, taxes, depreciation and amortization.