Tyson Foods 2014 Annual Report Download - page 218
Download and view the complete annual report
Please find page 218 of the 2014 Tyson Foods annual report below. You can navigate through the pages in the report by either clicking on the pages listed below, or by using the keyword search tool below to find specific information within the annual report.-
 1
1 -
2
-
3
-
4
-
5
-
6
-
7
-
8
-
9
-
10
-
11
-
12
-
13
-
14
-
15
-
16
-
17
-
18
-
19
-
20
-
21
-
22
-
23
-
24
-
25
-
26
-
27
-
28
-
29
-
30
-
31
-
32
-
33
-
34
-
35
-
36
-
37
-
38
-
39
-
40
-
41
-
42
-
43
-
44
-
45
-
46
-
47
-
48
-
49
-
50
-
51
-
52
-
53
-
54
-
55
-
56
-
57
-
58
-
59
-
60
-
61
-
62
-
63
-
64
-
65
-
66
-
67
-
68
-
69
-
70
-
71
-
72
-
73
-
74
-
75
-
76
-
77
-
78
-
79
-
80
-
81
-
82
-
83
-
84
-
85
-
86
-
87
-
88
-
89
-
90
-
91
-
92
-
93
-
94
-
95
-
96
-
97
-
98
-
99
-
100
-
101
-
102
-
103
-
104
-
105
-
106
-
107
-
108
-
109
-
110
-
111
-
112
-
113
-
114
-
115
-
116
-
117
-
118
-
119
-
120
-
121
-
122
-
123
-
124
-
125
-
126
-
127
-
128
-
129
-
130
-
131
-
132
-
133
-
134
-
135
-
136
-
137
-
138
-
139
-
140
-
141
-
142
-
143
-
144
-
145
-
146
-
147
-
148
-
149
-
150
-
151
-
152
-
153
-
154
-
155
-
156
-
157
-
158
-
159
-
160
-
161
-
162
-
163
-
164
-
165
-
166
-
167
-
168
-
169
-
170
-
171
-
172
-
173
-
174
-
175
-
176
-
177
-
178
-
179
-
180
-
181
-
182
-
183
-
184
-
185
-
186
-
187
-
188
-
189
-
190
-
191
-
192
-
193
-
194
-
195
-
196
-
197
-
198
-
199
-
200
-
201
-
202
-
203
-
204
-
205
-
206
-
207
-
 208
208 -
 209
209 -
 210
210 -
 211
211 -
 212
212 -
 213
213 -
 214
214 -
 215
215 -
 216
216 -
 217
217 -
 218
218 -
 219
219 -
 220
220 -
 221
221 -
 222
222 -
 223
223 -
 224
224 -
 225
225 -
 226
226 -
 227
227 -
 228
228
 |
 |
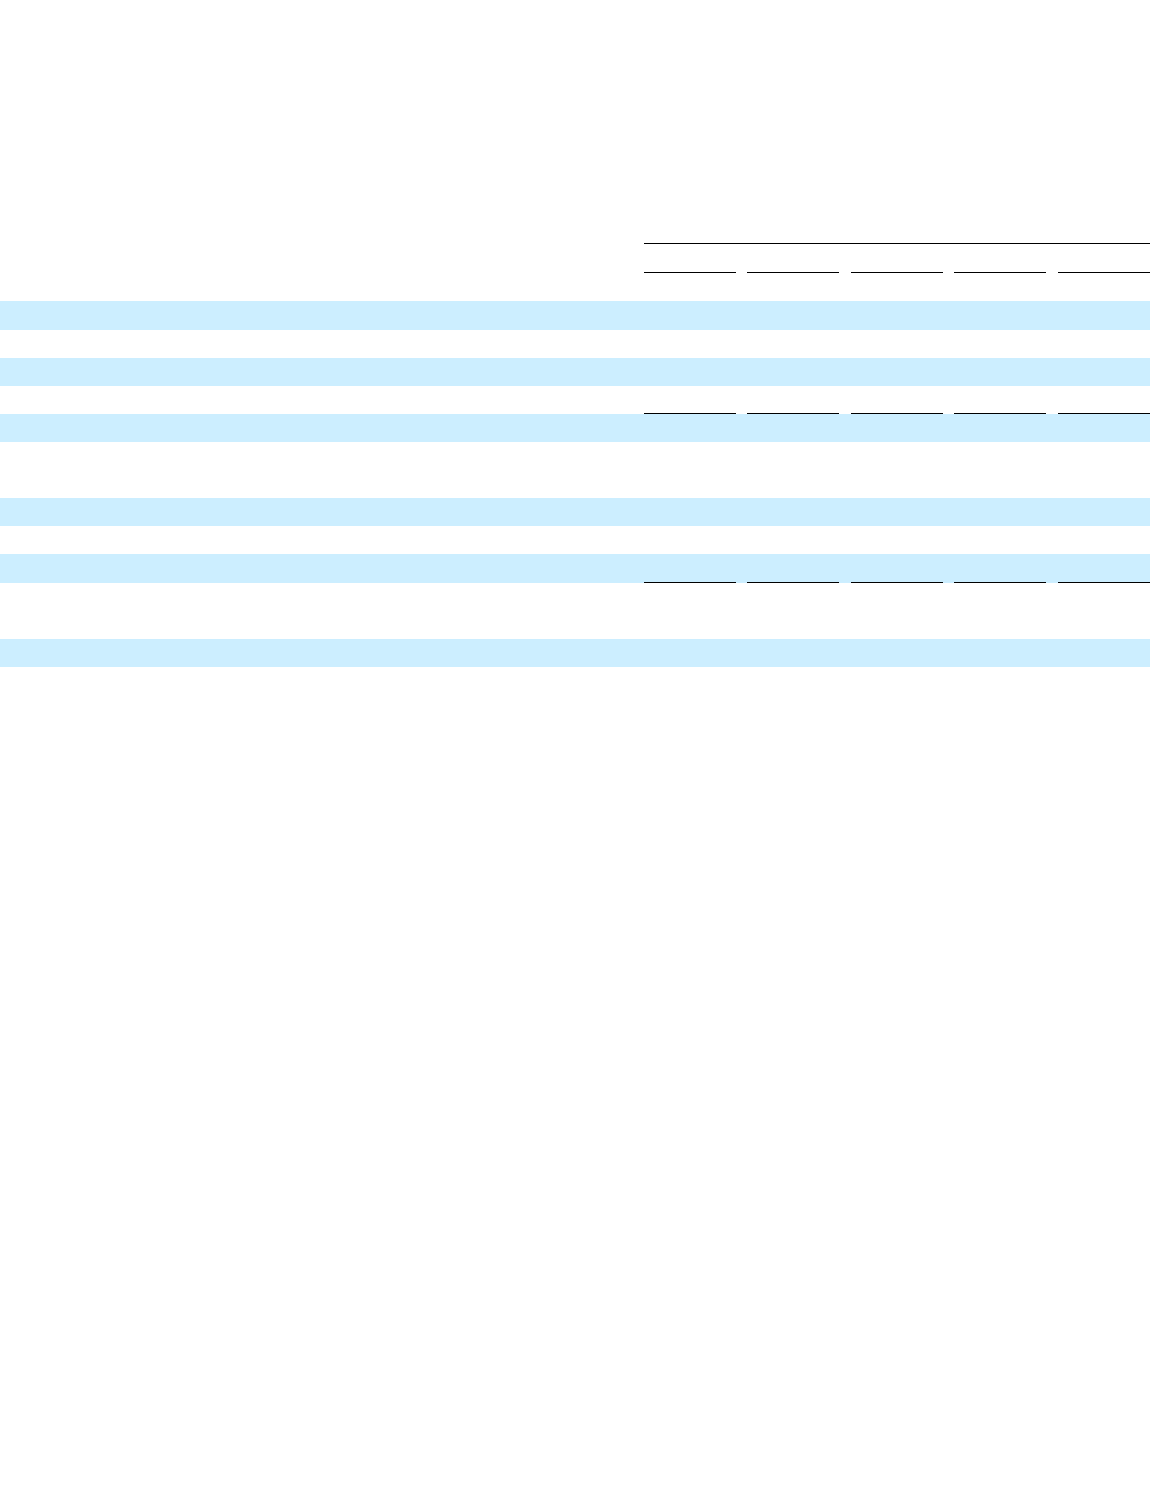
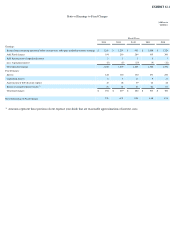
EXHIBIT 12.1
Ratio of Earnings to Fixed Charges
(dollars in
millions)
Fiscal Years
2014
2013
2012
2011
2010
Earnings:
Income from continuing operations before income taxes and equity method investment earnings
$
1,241
$
1,254
$
949
$
1,066
$
1,224
Add: Fixed charges
194
219
264
305
360
Add: Amortization of capitalized interest
5
5
5
4
3
Less: Capitalized interest
(8
)
(8
)
(10
)
(9
)
(11
)
Total adjusted earnings
1,432
1,470
1,208
1,366
1,576
Fixed Charges:
Interest
122
116
150
191
240
Capitalized interest
8
8
10
9
11
Amortization of debt discount expense
10
28
39
44
46
Rentals at computed interest factor
(1)
54
67
65
61
63
Total fixed charges
$
194
$
219
$
264
$
305
$
360
Ratio of Earnings to Fixed Charges
7.38
6.71
4.58
4.48
4.38
(1)
Amounts represent those portions of rent expense (one-
third) that are reasonable approximations of interest costs.