MetLife 2002 Annual Report Download - page 90
Download and view the complete annual report
Please find page 90 of the 2002 MetLife annual report below. You can navigate through the pages in the report by either clicking on the pages listed below, or by using the keyword search tool below to find specific information within the annual report.-
 1
1 -
2
-
3
-
4
-
5
-
6
-
7
-
8
-
9
-
10
-
11
-
12
-
13
-
14
-
15
-
16
-
17
-
18
-
19
-
20
-
21
-
22
-
23
-
24
-
25
-
26
-
27
-
28
-
29
-
30
-
31
-
32
-
33
-
34
-
35
-
36
-
37
-
38
-
39
-
40
-
41
-
42
-
43
-
44
-
45
-
46
-
47
-
48
-
49
-
50
-
51
-
52
-
53
-
54
-
55
-
56
-
57
-
58
-
59
-
60
-
61
-
62
-
63
-
64
-
65
-
66
-
67
-
68
-
69
-
70
-
71
-
72
-
73
-
74
-
75
-
76
-
77
-
78
-
79
-
 80
80 -
 81
81 -
 82
82 -
 83
83 -
 84
84 -
 85
85 -
 86
86 -
 87
87 -
 88
88 -
 89
89 -
 90
90 -
 91
91 -
 92
92 -
 93
93 -
 94
94
 |
 |

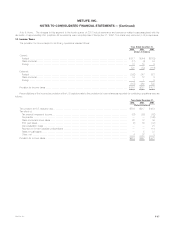
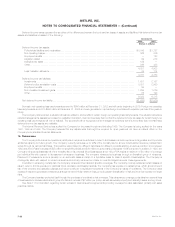
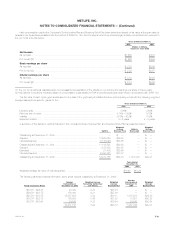
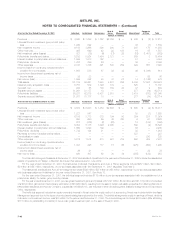
METLIFE, INC.
NOTES TO CONSOLIDATED FINANCIAL STATEMENTS — (Continued)
Auto & Asset Corporate
At or for the Year Ended December 31, 2001 Individual Institutional Reinsurance Home Management International & Other Total
(Dollars in millions)
Premiums *********************************** $ 4,563 $ 7,288 $ 1,762 $2,755 $ — $ 846 $ (2) $ 17,212
Universal life and investment-type product policy
fees ************************************** 1,260 592 — — — 38 (1) 1,889
Net investment income ************************ 6,188 3,966 390 200 71 267 173 11,255
Other revenues******************************* 495 649 42 22 198 16 85 1,507
Net investment gains (losses) ******************* 827 (15) (6) (17) 25 (16) (1,401) (603)
Policyholder benefits and claims***************** 5,233 8,924 1,484 2,121 — 689 3 18,454
Interest credited to policyholder account balances** 1,898 1,013 122 — — 51 — 3,084
Policyholder dividends ************************* 1,767 259 24 — — 36 — 2,086
Other expenses ****************************** 2,747 1,746 491 800 252 329 657 7,022
Income (loss) from continuing operations before
provision for income taxes ******************* 1,688 538 67 39 42 46 (1,806) 614
Income from discontinued operations, net of
income taxes ****************************** 38 23 — — — — 25 86
Net income (loss) ***************************** 1,095 382 40 41 27 14 (1,126) 473
Total assets********************************** 131,314 89,661 7,983 4,581 256 5,308 17,867 256,970
Deferred policy acquisition costs **************** 8,757 509 1,196 179 — 525 1 11,167
Goodwill, net********************************* 223 55 106 159 20 37 9 609
Separate account assets ********************** 31,261 31,177 13 — — 277 (14) 62,714
Policyholder liabilities ************************** 88,287 52,075 5,427 2,610 — 3,419 (813) 151,005
Separate account liabilities ********************* 31,261 31,177 13 — — 277 (14) 62,714
Auto & Asset Corporate
At or for the Year Ended December 31, 2000 Individual Institutional Reinsurance Home Management International & Other Total
(Dollars in millions)
Premiums *********************************** $ 4,673 $ 6,900 $ 1,450 $2,636 $ — $ 660 $ (2) $ 16,317
Universal life and investment-type product policy
fees ************************************** 1,221 547 — — — 53 (1) 1,820
Net investment income ************************ 6,108 3,712 379 194 90 254 287 11,024
Other revenues******************************* 650 650 29 40 760 9 91 2,229
Net investment gains (losses) ******************* 227 (475) (2) (20) — 18 (138) (390)
Policyholder benefits and claims***************** 5,054 8,178 1,096 2,005 — 562 (2) 16,893
Interest credited to policyholder account balances** 1,680 1,090 109 — — 56 — 2,935
Policyholder dividends ************************* 1,742 124 21 — — 32 — 1,919
Payments to former Canadian policyholders ******* — — — — — 327 — 327
Demutualization costs ************************* — — — — — — 230 230
Other expenses ****************************** 3,012 1,514 513 827 784 292 459 7,401
Income (loss) from continuing operations before
provision for income taxes ******************* 1,391 428 117 18 66 (275) (450) 1,295
Income from discontinued operations, net of
income taxes ****************************** 36 21 — — — — 22 79
Net income (loss) ***************************** 920 307 69 30 34 (285) (122) 953
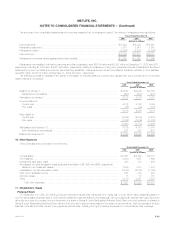
The International segment’s assets at December 31, 2002 and results of operations for the year ended December 31, 2002 include the assets and
results of operations of Hidalgo, a Mexican life insurer that was acquired in June 2002.
For the year ended December 31, 2001 the Institutional, Individual, Reinsurance and Auto & Home segments include $287 million, $24 million,
$9 million and $5 million, respectively, of pre-tax losses associated with the September 11, 2001 tragedies. See Note 2.
The Institutional, Individual and Auto & Home segments include $399 million, $97 million and $3 million, respectively, in pre-tax charges associated
with business realignment initiatives for the year ended December 31, 2001. See Note 13.
For the year ended December 31, 2001, the Individual segment includes $118 million of pre-tax expenses associated with the establishment of a
policyholder liability for certain group annuity policies.
For the year ended December 31, 2001, pre-tax gross investment gains and (losses) of $1,027 million, $142 million and ($1,172) million (comprised
of a $354 million gain and an intercompany elimination of ($1,526) million), resulting from the sale of certain real estate properties from Metropolitan Life to
Metropolitan Insurance and Annuity Company, a subsidiary of MetLife, Inc., are included in the Individual segment, Institutional segment and Corporate &
Other, respectively.
The Individual segment included an equity ownership interest in Nvest under the equity method of accounting. Nvest was included within the Asset
Management segment due to the types of products and strategies employed by the entity. The Individual segment’s equity in earnings of Nvest, which is
included in net investment income, was $30 million for the year ended December 31, 2000. The Individual segment includes $538 million (after allocating
$118 million to participating contracts) of the pre-tax gross investment gain on the sale of Nvest in 2000.
MetLife, Inc.
F-46