MetLife 2002 Annual Report Download - page 11
Download and view the complete annual report
Please find page 11 of the 2002 MetLife annual report below. You can navigate through the pages in the report by either clicking on the pages listed below, or by using the keyword search tool below to find specific information within the annual report.-
 1
1 -
 2
2 -
 3
3 -
 4
4 -
 5
5 -
 6
6 -
 7
7 -
 8
8 -
 9
9 -
 10
10 -
 11
11 -
 12
12 -
 13
13 -
 14
14 -
 15
15 -
 16
16 -
 17
17 -
 18
18 -
 19
19 -
 20
20 -
 21
21 -
 22
22 -
23
-
24
-
25
-
26
-
27
-
28
-
29
-
30
-
31
-
32
-
33
-
34
-
35
-
36
-
37
-
38
-
39
-
40
-
41
-
42
-
43
-
44
-
45
-
46
-
47
-
48
-
49
-
50
-
51
-
52
-
53
-
54
-
55
-
56
-
57
-
58
-
59
-
60
-
61
-
62
-
63
-
64
-
65
-
66
-
67
-
68
-
69
-
70
-
71
-
72
-
73
-
74
-
75
-
76
-
77
-
78
-
79
-
80
-
81
-
82
-
83
-
84
-
85
-
86
-
87
-
88
-
89
-
90
-
91
-
92
-
93
-
94
 |
 |

be reasonably estimated. Liabilities related to certain lawsuits, including the Company’s asbestos-related liability, are especially difficult to estimate due to
the limitation of available data and uncertainty regarding numerous variables used to determine amounts recorded. The data and variables that impact the
assumption used to estimate the Company’s asbestos-related liability include the number of future claims, the cost to resolve claims, the disease mix
and severity of disease, the jurisdiction of claims filed, tort reform efforts and the impact of any possible future adverse verdicts and their amounts. It is
possible that an adverse outcome in certain of the Company’s litigation, including asbestos-related cases, or the use of different assumptions in the
determination of amounts recorded could have a material effect upon the Company’s consolidated net income or cash flows in particular quarterly or
annual periods.
Employee Benefit Plans
The Company sponsors pension and other retirement plans in various forms covering employees who meet specified eligibility requirements. The
reported expense and liability associated with these plans requires an extensive use of assumptions which include the discount rate, expected return on
plan assets and rate of future compensation increases as determined by the Company. Management determines these assumptions based upon
currently available market and industry data, historical performance of the plan and its assets, and consultation with an independent consulting actuarial
firm to aid it in selecting appropriate assumptions and valuing its related liabilities. The actuarial assumptions used by the Company may differ materially
from actual results due to changing market and economic conditions, higher or lower withdrawal rates or longer or shorter life spans of the participants.
These differences may have a significant effect on the Company’s consolidated financial statements and liquidity.
The actuarial assumptions used in the calculation of the Company’s aggregate projected benefit obligation may vary and include an expectation of
long-term market appreciation in equity markets which is not changed by minor short-term market fluctuations, but does change when large interim
deviations occur. For the largest of the plans sponsored by the Company (the Metropolitan Life Retirement Plan for United States Employees, with a
projected benefit obligation of $4.3 billion or 98.6% of all qualified plans at December 31, 2002), the discount rate, expected rate of return on plan assets,
and the range of rates of future compensation increases used in that plan’s valuation at December 31, 2002 were 6.75%, 9% and 4% to 8%,
respectively. The expected rate of return on plan assets for use in that plan’s valuation in 2003 is currently anticipated to be 8.5%.
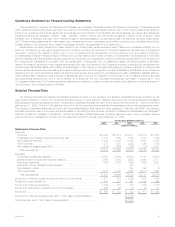
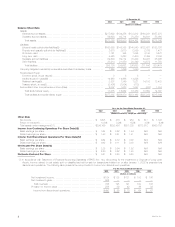
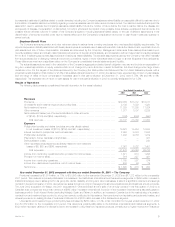
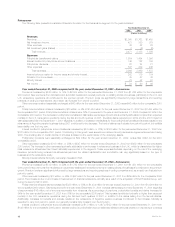
Results of Operations
The following table presents consolidated financial information for the years indicated:
Year Ended December 31,
2002 2001 2000
(Dollars in millions)
Revenues
Premiums*********************************************************************** $19,086 $17,212 $16,317
Universal life and investment-type product policy fees ********************************** 2,139 1,889 1,820
Net investment income *********************************************************** 11,329 11,255 11,024
Other revenues ****************************************************************** 1,377 1,507 2,229
Net investment losses (net of amounts allocable to other accounts
of ($145), ($134) and ($54), respectively) ****************************************** (784) (603) (390)
Total revenues*************************************************************** 33,147 31,260 31,000
Expenses
Policyholder benefits and claims (excludes amounts directly related
to net investment losses of ($150), ($159) and $41, respectively) ********************** 19,523 18,454 16,893
Interest credited to policyholder account balances ************************************* 2,950 3,084 2,935
Policyholder dividends ************************************************************ 1,942 2,086 1,919
Payments to former Canadian policyholders ****************************************** — — 327
Demutualization costs************************************************************* — — 230
Other expenses (excludes amounts directly related to net investment
losses of $5, $25 and ($95), respectively) ***************************************** 7,061 7,022 7,401
Total expenses ************************************************************** 31,476 30,646 29,705
Income from continuing operations before provision for income taxes ********************* 1,671 614 1,295
Provision for income taxes********************************************************* 516 227 421
Income from continuing operations************************************************** 1,155 387 874
Income from discontinued operations, net of income taxes****************************** 450 86 79
Net income ********************************************************************* $ 1,605 $ 473 $ 953
Year ended December 31, 2002 compared with the year ended December 31, 2001 — The Company
Premiums increased by $1,874 million, or 11%, to $19,086 million for the year ended December 31, 2002 from $17,212 million for the comparable
2001 period. This variance is primarily attributable to increases in the Institutional, International and Reinsurance segments. A $966 million increase in
Institutional is largely due to sales growth in its group life, dental, disability and long-term care businesses, a sale of a significant retirement and savings
contract in the second quarter of 2002, as well as new sales throughout 2002 in this segment’s structured settlements and traditional annuity products.
The June 2002 acquisition of Hidalgo, the 2001 acquisitions in Chile and Brazil and the sale of an annuity contract in the first quarter of 2002 to a
Canadian trust company are the primary drivers of a $665 million increase in International. A portion of the increase in International is also attributable to
business growth in South Korea, Mexico (excluding Hidalgo), Spain and Taiwan. In addition, an increase in Canada due to the restructuring of a pension
contract from an investment-type product to a long-term annuity contributed to this variance. New premiums from facultative and automatic treaties, and
renewal premiums on existing blocks of business contributed to a $243 million increase in the Reinsurance segment.
Universal life and investment-type product policy fees increased by $250 million, or 13%, to $2,139 million for the year ended December 31, 2002
from $1,889 million for the comparable 2001 period. This variance is primarily attributable to the Individual, International and Institutional segments. A
$120 million favorable variance in Individual is due to an increase in policy fees from insurance products, primarily due to higher revenue from insurance
MetLife, Inc. 7