MetLife 2002 Annual Report Download - page 87
Download and view the complete annual report
Please find page 87 of the 2002 MetLife annual report below. You can navigate through the pages in the report by either clicking on the pages listed below, or by using the keyword search tool below to find specific information within the annual report.-
 1
1 -
2
-
3
-
4
-
5
-
6
-
7
-
8
-
9
-
10
-
11
-
12
-
13
-
14
-
15
-
16
-
17
-
18
-
19
-
20
-
21
-
22
-
23
-
24
-
25
-
26
-
27
-
28
-
29
-
30
-
31
-
32
-
33
-
34
-
35
-
36
-
37
-
38
-
39
-
40
-
41
-
42
-
43
-
44
-
45
-
46
-
47
-
48
-
49
-
50
-
51
-
52
-
53
-
54
-
55
-
56
-
57
-
58
-
59
-
60
-
61
-
62
-
63
-
64
-
65
-
66
-
67
-
68
-
69
-
70
-
71
-
72
-
73
-
74
-
75
-
76
-
 77
77 -
 78
78 -
 79
79 -
 80
80 -
 81
81 -
 82
82 -
 83
83 -
 84
84 -
 85
85 -
 86
86 -
 87
87 -
 88
88 -
 89
89 -
 90
90 -
 91
91 -
 92
92 -
 93
93 -
 94
94
 |
 |

METLIFE, INC.
NOTES TO CONSOLIDATED FINANCIAL STATEMENTS — (Continued)
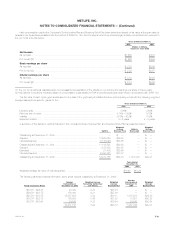
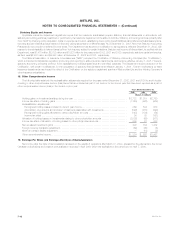
The following presents a reconciliation of the weighted average shares used in calculating basic earnings per share to those used in calculating
diluted earnings per share:
For the Years Ended December 31,
2002 2001 2000
(Dollars in millions, except share and per share
data)
Weighted average common stock outstanding for basic earnings per share *************** 704,599,115 741,041,654 772,027,666
Incremental shares from assumed:
Conversion of forward purchase contracts***************************************** 24,596,950 25,974,114 16,480,028
Exercise of stock options ******************************************************* 5,233 1,133 —
Weighted average common stock outstanding for diluted earnings per share************** 729,201,298 767,016,901 788,507,694
Income from Continuing Operations******************************************** $ 1,155 $ 387 $ 1,114(1)
Basic earnings per share ******************************************************* $ 1.64 $ 0.52 $ 1.44
Diluted earnings per share ****************************************************** $ 1.58 $ 0.51 $ 1.41
Income from Discontinued Operations ***************************************** $ 450 $ 86 $ 59(1)
Basic earnings per share ******************************************************* $ 0.64 $ 0.12 $ 0.08
Diluted earnings per share ****************************************************** $ 0.62 $ 0.11 $ 0.08
Net Income ******************************************************************* $ 1,605 $ 473 $ 1,173(1)
Basic earnings per share ******************************************************* $ 2.28 $ 0.64 $ 1.52
Diluted earnings per share ****************************************************** $ 2.20 $ 0.62 $ 1.49
(1) For the period April 7, 2000 through December 31, 2000.
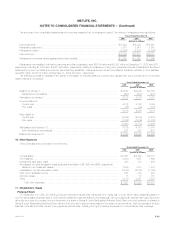
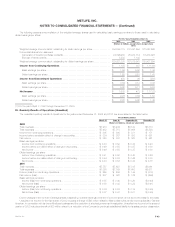
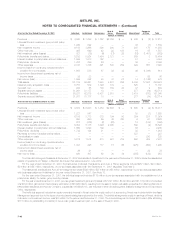
20. Quarterly Results of Operations (Unaudited)
The unaudited quarterly results of operations for the years ended December 31, 2002 and 2001 are summarized in the table below:
Three Months Ended
March 31 June 30 September 30 December 31
(Dollars in millions, except per share data)
2002
Total revenues******************************************************* $7,973 $8,244 $8,120 $8,810
Total expenses ****************************************************** $7,482 $7,715 $7,686 $8,593
Income from continuing operations************************************** $ 305 $ 368 $ 311 $ 171
Income before cumulative effect of change in accounting******************* $ 324 $ 387 $ 333 $ 561
Net income ********************************************************* $ 329 $ 387 $ 328 $ 561
Basic earnings per share
Income from continuing operations************************************ $ 0.43 $ 0.52 $ 0.44 $ 0.24
Income before cumulative effect of change in accounting***************** $ 0.46 $ 0.55 $ 0.47 $ 0.80
Net income ******************************************************* $ 0.46 $ 0.55 $ 0.47 $ 0.80
Diluted earnings per share
Income from continuing operations************************************ $ 0.41 $ 0.50 $ 0.43 $ 0.24
Income before cumulative effect of change in accounting***************** $ 0.44 $ 0.53 $ 0.46 $ 0.78
Net income ******************************************************* $ 0.44 $ 0.53 $ 0.45 $ 0.78
2001
Total revenues******************************************************* $7,757 $7,627 $7,815 $8,061
Total expenses ****************************************************** $7,363 $7,169 $7,603 $8,511
Income (loss) from continuing operations********************************* $ 265 $ 296 $ 144 $ (318)
Net income (loss) **************************************************** $ 287 $ 320 $ 162 $ (296)
Basic earnings per share
Income (loss) from continuing operations******************************* $ 0.35 $ 0.40 $ 0.20 $ (0.44)
Net income (loss) ************************************************** $ 0.38 $ 0.43 $ 0.22 $ (0.41)
Diluted earnings per share
Income (loss) from continuing operations******************************* $ 0.34 $ 0.38 $ 0.19 $ (0.43)
Net income (loss) ************************************************** $ 0.37 $ 0.41 $ 0.21 $ (0.40)
Due to changes in the number of average shares outstanding, quarterly earnings per share of common stock do not add to the totals for the years.
Unaudited net income for the first quarter of 2002 includes a charge of $48 million related to Metropolitan Life’s wholly-owned subsidiary, General
American, in connection with its former Medicare business and the resolution of a federal government investigation. Unaudited net income for the second
quarter of 2002 includes a benefit of $30 million related to a reduction of the Company’s previously established liability for its sales practice class action
MetLife, Inc. F-43