MetLife 2002 Annual Report Download - page 39
Download and view the complete annual report
Please find page 39 of the 2002 MetLife annual report below. You can navigate through the pages in the report by either clicking on the pages listed below, or by using the keyword search tool below to find specific information within the annual report.-
 1
1 -
2
-
3
-
4
-
5
-
6
-
7
-
8
-
9
-
10
-
11
-
12
-
13
-
14
-
15
-
16
-
17
-
18
-
19
-
20
-
21
-
22
-
23
-
24
-
25
-
26
-
27
-
28
-
 29
29 -
 30
30 -
 31
31 -
 32
32 -
 33
33 -
 34
34 -
 35
35 -
 36
36 -
 37
37 -
 38
38 -
 39
39 -
 40
40 -
 41
41 -
 42
42 -
 43
43 -
 44
44 -
 45
45 -
 46
46 -
 47
47 -
 48
48 -
 49
49 -
50
-
51
-
52
-
53
-
54
-
55
-
56
-
57
-
58
-
59
-
60
-
61
-
62
-
63
-
64
-
65
-
66
-
67
-
68
-
69
-
70
-
71
-
72
-
73
-
74
-
75
-
76
-
77
-
78
-
79
-
80
-
81
-
82
-
83
-
84
-
85
-
86
-
87
-
88
-
89
-
90
-
91
-
92
-
93
-
94
 |
 |

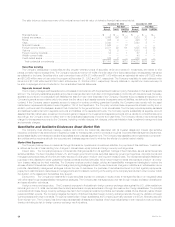
Real Estate and Real Estate Joint Ventures
The Company’s real estate and real estate joint venture investments consist of commercial and agricultural properties located primarily throughout
the U.S. The Company manages these investments through a network of regional offices overseen by its investment department. At December 31, 2002
and 2001, the carrying value of the Company’s real estate, real estate joint ventures and real estate held-for-sale was $4,725 million and $5,730 million,
respectively, or 2.5% and 3.4% of total cash and invested assets, respectively. The carrying value of real estate is stated at depreciated cost net of
impairments and valuation allowances. The carrying value of real estate joint ventures is stated at the Company’s equity in the real estate joint ventures
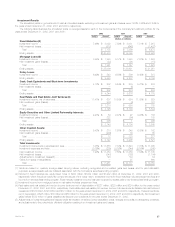
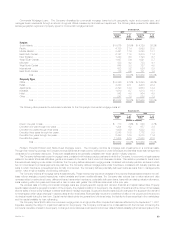
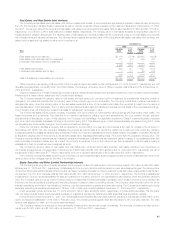
net of impairments and valuation allowances. The following table presents the carrying value of the Company’s real estate, real estate joint ventures, real
estate held-for-sale and real estate acquired upon foreclosure at:
December 31,
2002 2001
Carrying % of Carrying % of
Type Value Total Value Total
(Dollars in millions)
Real estate held-for-investment ******************************************************* $4,116 87.1% $3,698 64.5%
Real estate joint ventures held-for-investment ******************************************* 377 8.0 356 6.2
Foreclosed real estate held-for-investment ********************************************** 3 0.1 — 0.0
4,496 95.2 4,054 70.7
Real estate held-for-sale ************************************************************* 222 4.7 1,627 28.4
Foreclosed real estate held-for-sale**************************************************** 7 0.1 49 0.9
229 4.8 1,676 29.3
Total real estate and real estate joint ventures ******************************************* $4,725 100.0% $5,730 100.0%
Office properties, representing 58% and 63% of the Company’s equity real estate portfolio at December 31, 2002 and 2001, respectively, are well
diversified geographically, principally within the United States. The average occupancy level of office properties was 92% and 91% at December 31,
2002 and 2001, respectively.
Ongoing management of these investments includes quarterly valuations, as well as an annual market update and review of each property’s budget,
financial returns, lease rollover status and the Company’s exit strategy.
The Company adjusts the carrying value of real estate and real estate joint ventures held-for-investment for impairments whenever events or
changes in circumstances indicate that the carrying value of the property may not be recoverable. The Company writes down impaired real estate to
estimated fair value, when the carrying value of the real estate exceeds the sum of the undiscounted cash flow expected to result from the use and
eventual disposition of the real estate. The Company records writedowns as investment losses and reduces the cost basis of the properties accordingly.
The Company does not change the revised cost basis for subsequent recoveries in value.
The current real estate equity portfolio is mainly comprised of a core portfolio of multi-tenanted office buildings with high tenant credit quality, net
leased properties and apartments. The objective is to maximize earnings by building upon and strengthening the core portfolio through selective
acquisitions and dispositions. In light of this objective, the Company took advantage of a significant demand for Class A, institutional grade properties
and, as a result, sold certain real estate holdings in its portfolio during 2002. This sales program, which was substantially completed during 2002, does
not represent any fundamental change in the Company’s investment strategy.
Once the Company identifies a property that is expected to be sold within one year and commences a firm plan for marketing the property, in
accordance with SFAS 144, the Company classifies the property as held-for-sale and reports the related net investment income and any resulting
investments gains and losses as discontinued operations. Further, the Company establishes and periodically revises, if necessary, a valuation allowance
to adjust the carrying value of the property to its expected sales value, less associated selling costs, if it is lower than the property’s carrying value. The
Company records valuation allowances as investment losses and subsequent adjustments as investment gains or losses. If circumstances arise that
were previously considered unlikely and, as a result, the property is expected to be on the market longer than anticipated, a held-for-sale property is
reclassified to held-for-investment and measured as such.
The Company’s carrying value of real estate and real estate joint ventures held-for-sale, including real estate acquired upon foreclosure of
commercial and agricultural mortgage loans, in the amounts of $229 million and $1,676 million at December 31, 2002 and 2001, respectively, are net of
impairments of $82 million and $177 million, respectively, and net of valuation allowances of $16 million and $35 million, respectively.
The Company records real estate acquired upon foreclosure of commercial and agricultural mortgage loans at the lower of estimated fair value or the
carrying value of the mortgage loan at the date of foreclosure.
Equity Securities and Other Limited Partnership Interests
The Company’s carrying value of equity securities, which primarily consist of investments in common stocks, was $1,348 million and $3,063 million
at December 31, 2002 and 2001, respectively. Substantially all of the common stock is publicly traded on major securities exchanges. The carrying value
of the other limited partnership interests (which primarily represent ownership interests in pooled investment funds that make private equity investments in
companies in the U.S. and overseas) was $2,395 million and $1,637 million at December 31, 2002 and 2001, respectively. The Company classifies its
investments in common stocks as available-for-sale and marks them to market, except for non-marketable private equities, which are generally carried at
cost. The Company uses the equity method of accounting for investments in limited partnership interests in which it has more than a minor interest, has
influence over the partnership’s operating and financial policies and does not have a controlling interest. The Company uses the cost method for minor
interest investments and when it has virtually no influence over the partnership’s operating and financial policies. The Company’s investments in equity
securities excluding partnerships represented 0.7% and 1.8% of cash and invested assets at December 31, 2002 and 2001, respectively.
Equity securities include, at December 31, 2002 and 2001, $443 million and $329 million, respectively, of private equity securities. The Company
may not freely trade its private equity securities because of restrictions imposed by federal and state securities laws and illiquid markets.
During the year ended December 31, 2001, two exchangeable subordinated debt securities matured, resulting in a gross gain of $44 million on the
equity exchanged in satisfaction of the note. In February 2002, the remaining exchangeable debt security issued to the Company matured. The debt
security was satisfied for cash, and no equity was exchanged.
The Company makes commitments to fund partnership investments in the normal course of business. The amounts of these unfunded commit-
ments were $1,667 million and $1,898 million at December 31, 2002 and 2001, respectively.
MetLife, Inc. 35