MetLife 2002 Annual Report Download - page 40
Download and view the complete annual report
Please find page 40 of the 2002 MetLife annual report below. You can navigate through the pages in the report by either clicking on the pages listed below, or by using the keyword search tool below to find specific information within the annual report.-
 1
1 -
2
-
3
-
4
-
5
-
6
-
7
-
8
-
9
-
10
-
11
-
12
-
13
-
14
-
15
-
16
-
17
-
18
-
19
-
20
-
21
-
22
-
23
-
24
-
25
-
26
-
27
-
28
-
29
-
 30
30 -
 31
31 -
 32
32 -
 33
33 -
 34
34 -
 35
35 -
 36
36 -
 37
37 -
 38
38 -
 39
39 -
 40
40 -
 41
41 -
 42
42 -
 43
43 -
 44
44 -
 45
45 -
 46
46 -
 47
47 -
 48
48 -
 49
49 -
 50
50 -
51
-
52
-
53
-
54
-
55
-
56
-
57
-
58
-
59
-
60
-
61
-
62
-
63
-
64
-
65
-
66
-
67
-
68
-
69
-
70
-
71
-
72
-
73
-
74
-
75
-
76
-
77
-
78
-
79
-
80
-
81
-
82
-
83
-
84
-
85
-
86
-
87
-
88
-
89
-
90
-
91
-
92
-
93
-
94
 |
 |

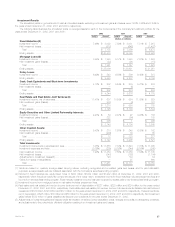
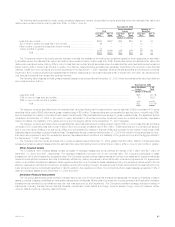
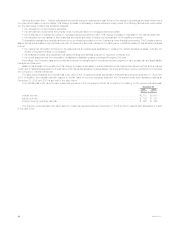
The following tables set forth the cost, gross unrealized gain or loss and estimated fair value of the Company’s equity securities, as well as the
percentage of the total equity securities at:
December 31, 2002
Gross
Unrealized Estimated % of
Cost Gain Loss Fair Value Total
(Dollars in millions)
Equity Securities:
Common stocks ********************************************************* $ 877 $115 $79 $ 913 67.7%
Nonredeemable preferred stocks******************************************** 426 13 4 435 32.3
Total equity securities *********************************************** $1,303 $128 $83 $1,348 100.0%
December 31, 2001
Gross
Unrealized Estimated % of
Cost Gain Loss Fair Value Total
(Dollars in millions)
Equity Securities:
Common stocks ************************************************************* $1,968 $657 $78 $2,547 83.2%
Nonredeemable preferred stocks************************************************ 491 28 3 516 16.8
Total equity securities *************************************************** $2,459 $685 $81 $3,063 100.0%
Problem and Potential Problem Equity Securities and Other Limited Partnership Interests
The Company monitors its equity securities and other limited partnership interests on a continual basis. Through this monitoring process, the
Company identifies investments that management considers to be problems or potential problems.
Problem equity securities and other limited partnership interests are defined as securities (i) in which significant declines in revenues and/or margins
threaten the ability of the issuer to continue operating, or (ii) where the issuer has entered into bankruptcy.
Potential problem equity securities and other limited partnership interests are defined as securities issued by a company that is experiencing
significant operating problems or difficult industry conditions. Criteria generally indicative of these problems or conditions are (i) cash flows falling below
varying thresholds established for the industry and other relevant factors, (ii) significant declines in revenues and/or margins, (iii) public securities trading at
a substantial discount compared to original cost as a result of specific credit concerns, and (iv) other information that becomes available.
Equity Security Impairment. The Company classifies all of its equity securities as available-for-sale and marks them to market through other
comprehensive income. All securities with gross unrealized losses at the consolidated balance sheet date are subjected to the Company’s process for
identifying other-than-temporary impairments. The Company writes down to fair value securities that it deems to be other-than-temporarily impaired in the
period the securities are deemed to be so impaired. The assessment of whether such impairment has occurred is based on management’s case-by-
case evaluation of the underlying reasons for the decline in fair value. Management considers a wide range of factors, as described below, about the
security issuer and uses its best judgment in evaluating the cause of the decline in the estimated fair value of the security and in assessing the prospects
for near-term recovery. Inherent in management’s evaluation of the security are assumptions and estimates about the operations of the issuer and its
future earnings potential.
Considerations used by the Company in the impairment evaluation process include, but are not limited to, the following:
)The length of time and the extent to which the market value has been below cost;
)The potential for impairments of securities when the issuer is experiencing significant financial difficulties, including a review of all securities of the
issuer, including its known subsidiaries and affiliates, regardless of the form of the Company’s ownership;
)The potential for impairments in an entire industry sector or sub-sector;
)The potential for impairments in certain economically depressed geographic locations;
)The potential for impairments of securities where the issuer, series of issuers or industry has suffered a catastrophic type of loss or has exhausted
natural resources; and
)Other subjective factors, including concentrations and information obtained from regulators and rating agencies.
Equity securities or other limited partnership interests which are deemed to be other-than-temporarily impaired are written down to fair value. The
Company records writedowns as investment losses and adjusts the cost basis of the equity securities accordingly. The Company does not change the
revised cost basis for subsequent recoveries in value. Writedowns of equity securities and other limited partnership interests were $191 million and
$142 million for the years ended December 31, 2002 and 2001, respectively. During the years ended December 31, 2002 and 2001, the Company sold
equity securities with an estimated fair value of $915 million and $1,311 million at a loss of $85 million and $41 million, respectively.
The gross unrealized loss related to the Company’s equity securities at December 31, 2002 was $83 million. Such securities are concentrated by
security type in common stock (61%) and mutual funds (35%); and are concentrated by industry in financial (59%) and domestic broad market mutual
funds (34%) (calculated as a percentage of gross unrealized loss).
MetLife, Inc.
36