MetLife 2002 Annual Report Download - page 41
Download and view the complete annual report
Please find page 41 of the 2002 MetLife annual report below. You can navigate through the pages in the report by either clicking on the pages listed below, or by using the keyword search tool below to find specific information within the annual report.-
 1
1 -
2
-
3
-
4
-
5
-
6
-
7
-
8
-
9
-
10
-
11
-
12
-
13
-
14
-
15
-
16
-
17
-
18
-
19
-
20
-
21
-
22
-
23
-
24
-
25
-
26
-
27
-
28
-
29
-
30
-
 31
31 -
 32
32 -
 33
33 -
 34
34 -
 35
35 -
 36
36 -
 37
37 -
 38
38 -
 39
39 -
 40
40 -
 41
41 -
 42
42 -
 43
43 -
 44
44 -
 45
45 -
 46
46 -
 47
47 -
 48
48 -
 49
49 -
 50
50 -
 51
51 -
52
-
53
-
54
-
55
-
56
-
57
-
58
-
59
-
60
-
61
-
62
-
63
-
64
-
65
-
66
-
67
-
68
-
69
-
70
-
71
-
72
-
73
-
74
-
75
-
76
-
77
-
78
-
79
-
80
-
81
-
82
-
83
-
84
-
85
-
86
-
87
-
88
-
89
-
90
-
91
-
92
-
93
-
94
 |
 |

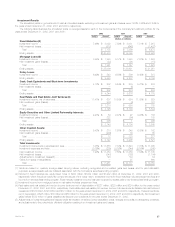
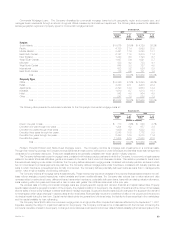
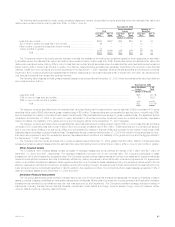
The following table presents the costs, gross unrealized losses and number of securities for equity securities where the estimated fair value had
declined and remained below cost by less than 20%, or 20% or more for:
December 31, 2002
Gross Unrealized Number of
Cost Losses Securities
Less than 20% or Less than 20% or Less than 20% or
20% More 20% More 20% More
(Dollars in millions)
Less than six months********************************************** $298 $292 $25 $58 27 23
Six months or greater but less than nine months *********************** 49 — — — 19 —
Nine months or greater but less than twelve months ******************** ——————
Twelve months or greater ****************************************** 18 — — — 15 —
Total **************************************************** $365 $292 $25 $58 61 23
The Company’s review of its equity security exposure includes the analysis of the total gross unrealized losses by three categories of securities:
(i) securities where the estimated fair value had declined and remained below cost by less than 20%; (ii) securities where the estimated fair value had
declined and remained below cost by 20% or more for less than six months; and (iii) securities where the estimated fair value had declined and remained
below cost by 20% or more for six months or greater. The first two categories have generally been adversely impacted by the downturn in the financial
markets, overall economic conditions and continuing effects of the September 11, 2001 tragedies. While all of these securities are monitored for potential
impairment, the Company’s experience indicates that the first two categories do not present as great a risk of impairment, and often, fair values recover
over time as the factors that caused the declines improve.
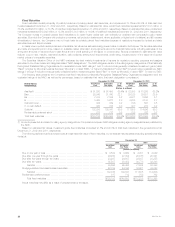
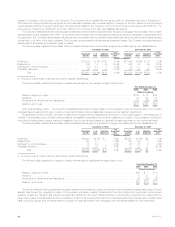
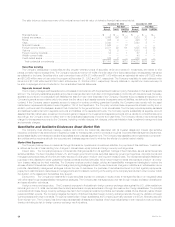
The following table presents the total gross unrealized losses for equity securities at December 31, 2002 where the estimated fair value had declined
and remained below cost by:
December 31, 2002
Gross Unrealized % of
Losses Total
(Dollars in millions)
Less than 20% ********************************************************************************** $25 30.1%
20% or more for less than six months *************************************************************** 58 69.9
20% or more for six months or greater*************************************************************** ——
Total *********************************************************************************** $83 100.0%
The category of equity securities where the estimated fair value has declined and remained below cost by less than 20% is comprised of 61 equity
securities with a cost of $365 million and a gross unrealized loss of $25 million. These securities are concentrated by security type in mutual funds (78%);
and concentrated by industry in domestic broad market mutual funds (78%) (calculated as a percentage of gross unrealized loss). The significant factors
considered at December 31, 2002 in the review of equity securities for other-than-temporary impairment were the unusual and severely depressed
market conditions, the instability of the global economy and the lagging effects of the September 11, 2001 tragedies.
The category of equity securities where the estimated fair value has declined and remained below cost by 20% or more for less than six months is
comprised of 23 equity securities with a cost of $292 million and a gross unrealized loss of $58 million. These securities are concentrated by security
type in common stock (80%) and mutual funds (15%); and concentrated by industry in financial (80%) and domestic broad market mutual funds (15%)
(calculated as a percentage of gross unrealized loss). The significant factors considered at December 31, 2002 in the review of equity securities for other-
than-temporary impairment were the unusual and severely depressed market conditions, the instability of the global economy and the lagging effects of
the September 11, 2001 tragedies.
The Company held two equity securities with a gross unrealized loss at December 31, 2002 greater than $5 million. Neither of these securities
represented gross unrealized losses where the estimated fair value had declined and remained below cost by 20% or more for six months or greater.
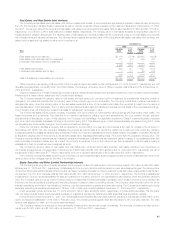
Other Invested Assets
The Company’s other invested assets consist principally of leveraged leases and funds withheld at interest of $3.1 billion and $2.7 billion at
December 31, 2002 and 2001, respectively. The leveraged leases are recorded net of non-recourse debt. The Company participates in lease
transactions, which are diversified by geographic area. The Company regularly reviews residual values and writes down residuals to expected values as
needed. Funds withheld represent amounts contractually withheld by ceding companies in accordance with reinsurance agreements. For agreements
written on a modified coinsurance basis and certain agreements written on a coinsurance basis, assets supporting the reinsured policies equal to the net
statutory reserves are withheld and continue to be legally owned by the ceding company. Interest accrues to these funds withheld at rates defined by the
treaty terms and may be contractually specified or directly related to the investment portfolio. The Company’s other invested assets represented 1.9% of
cash and invested assets at both December 31, 2002 and 2001.
Derivative Financial Instruments
The Company uses derivative instruments to manage risk through one of four principal risk management strategies: the hedging of liabilities, invested
assets, portfolios of assets or liabilities and anticipated transactions. Additionally, Metropolitan Life enters into income generation and replication derivative
transactions as permitted by its derivatives use plan that was approved by the Department. The Company’s derivative strategy employs a variety of
instruments, including financial futures, financial forwards, interest rate, credit default and foreign currency swaps, foreign currency forwards, written
covered calls and options, including caps and floors.
MetLife, Inc. 37