MetLife 2002 Annual Report Download - page 38
Download and view the complete annual report
Please find page 38 of the 2002 MetLife annual report below. You can navigate through the pages in the report by either clicking on the pages listed below, or by using the keyword search tool below to find specific information within the annual report.-
 1
1 -
2
-
3
-
4
-
5
-
6
-
7
-
8
-
9
-
10
-
11
-
12
-
13
-
14
-
15
-
16
-
17
-
18
-
19
-
20
-
21
-
22
-
23
-
24
-
25
-
26
-
27
-
 28
28 -
 29
29 -
 30
30 -
 31
31 -
 32
32 -
 33
33 -
 34
34 -
 35
35 -
 36
36 -
 37
37 -
 38
38 -
 39
39 -
 40
40 -
 41
41 -
 42
42 -
 43
43 -
 44
44 -
 45
45 -
 46
46 -
 47
47 -
 48
48 -
49
-
50
-
51
-
52
-
53
-
54
-
55
-
56
-
57
-
58
-
59
-
60
-
61
-
62
-
63
-
64
-
65
-
66
-
67
-
68
-
69
-
70
-
71
-
72
-
73
-
74
-
75
-
76
-
77
-
78
-
79
-
80
-
81
-
82
-
83
-
84
-
85
-
86
-
87
-
88
-
89
-
90
-
91
-
92
-
93
-
94
 |
 |

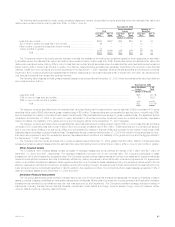
transfer of ownership of the property to the Company. The Company did not classify this loan as a problem or potential problem as of December 31,
2002 since the obligor is performing as agreed and the estimated collateral value provides sufficient coverage for the loan. Based on the Company’s
current estimate that the property’s market value exceeds the loan balance, the Company would not record a loss in accordance with SFAS No. 114,
Accounting by Creditors for Impairments of a Loan (‘‘SFAS 114’’) in the event the loan was classified as impaired.
The Company establishes valuation allowances for loans that it deems impaired, as determined through its mortgage review process. The Company
defines impaired loans consistent with SFAS 114 as loans which it probably will not collect all amounts due according to applicable contractual terms of
the agreement. The Company bases valuation allowances upon the present value of expected future cash flows discounted at the loan’s original effective
interest rate or the value of the loan’s collateral. The Company records valuation allowances as investment losses. The Company records subsequent
adjustments to allowances as investment gains or losses.
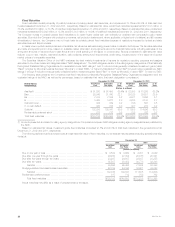
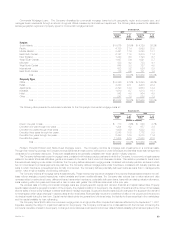
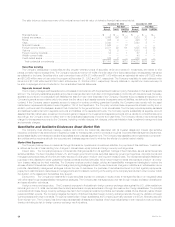
The following table presents the amortized cost and valuation allowance for commercial mortgage loans distributed by loan classification at:
December 31, 2002 December 31, 2001
% of % of
Amortized % of Valuation Amortized Amortized % of Valuation Amortized
Cost(1) Total Allowance Cost Cost(1) Total Allowance Cost
(Dollars in millions)
Performing ******************************************** $19,343 98.3% $ 60 0.3% $17,495 96.6% $ 52 0.3%
Restructured******************************************* 246 1.3 49 19.9% 448 2.5 55 12.3%
Delinquent or under foreclosure*************************** 14 0.1 — 0.0% 14 0.1 7 50.0%
Potentially delinquent************************************ 68 0.3 10 14.7% 136 0.8 20 14.7%
Total ***************************************** $19,671 100.0% $119 0.6% $18,093 100.0% $134 0.7%
(1) Amortized cost is equal to carrying value before valuation allowances.
The following table presents the changes in valuation allowances for commercial mortgage loans for the:
Year Ended December 31,
2002 2001 2000
(Dollars in millions)
Balance, beginning of year ************************************************************************ $134 $ 76 $ 69
Additions *************************************************************************************** 38 84 61
Deductions for writedowns and dispositions ********************************************************** (53) (26) (54)
Balance, end of year ***************************************************************************** $119 $134 $ 76
Agricultural Mortgage Loans. The Company diversifies its agricultural mortgage loans by both geographic region and product type. The Company
manages these investments through a network of regional offices and field professionals overseen by its investment department.
Approximately 63.5% of the $5,146 million of agricultural mortgage loans outstanding at December 31, 2002 were subject to rate resets prior to
maturity. A substantial portion of these loans generally is successfully renegotiated and remains outstanding to maturity. The process and policies for
monitoring the agricultural mortgage loans and classifying them by performance status are generally the same as those for the commercial loans.
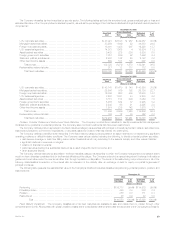
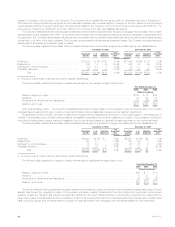
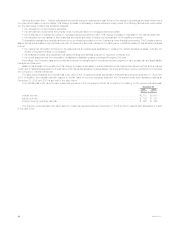
The following table presents the amortized cost and valuation allowances for agricultural mortgage loans distributed by loan classification at:
December 31, 2002 December 31, 2001
% of % of
Amortized % of Valuation Amortized Amortized % of Valuation Amortized
Cost(1) Total Allowance Cost Cost(1) Total Allowance Cost
(Dollars in millions)
Performing ******************************************** $4,980 96.7% $ — 0.0% $5,055 95.8% $3 0.1%
Restructured******************************************* 140 2.7 5 3.6% 188 3.6 3 1.6%
Delinquent or under foreclosure **************************** 14 0.3 — 0.0% 29 0.5 2 6.9%
Potentially delinquent************************************* 18 0.3 1 5.6% 5 0.1 1 20.0%
Total****************************************** $ 5,152 100.0% $ 6 0.1% $ 5,277 100.0% $9 0.2%
(1) Amortized cost is equal to carrying value before valuation allowances.
The following table presents the changes in valuation allowances for agricultural mortgage loans for the:
Year Ended December 31,
2002 2001 2000
(Dollars in millions)
Balance, beginning of year*************************************************************************** $9 $ 7 $18
Additions ***************************************************************************************** 321 8
Deductions for writedowns and dispositions ************************************************************ (6) (19) (19)
Balance, end of year******************************************************************************** $6 $9 $7
The principal risks in holding agricultural mortgage loans are property specific, supply and demand, and financial and capital market risks. Property
specific risks include the geographic location of the property, soil types, weather conditions and the other factors that may impact the borrower’s
guaranty. Supply and demand risks include the supply and demand for the commodities produced on the specific property and the related price for
those commodities. Financial risks include the overall level of debt on the property and the amount of principal repaid during the loan term. Capital market
risks include the general level of interest rates, the liquidity for these securities in the marketplace and the capital available for loan refinancing.
MetLife, Inc.
34