MetLife 2002 Annual Report Download - page 37
Download and view the complete annual report
Please find page 37 of the 2002 MetLife annual report below. You can navigate through the pages in the report by either clicking on the pages listed below, or by using the keyword search tool below to find specific information within the annual report.-
 1
1 -
2
-
3
-
4
-
5
-
6
-
7
-
8
-
9
-
10
-
11
-
12
-
13
-
14
-
15
-
16
-
17
-
18
-
19
-
20
-
21
-
22
-
23
-
24
-
25
-
26
-
 27
27 -
 28
28 -
 29
29 -
 30
30 -
 31
31 -
 32
32 -
 33
33 -
 34
34 -
 35
35 -
 36
36 -
 37
37 -
 38
38 -
 39
39 -
 40
40 -
 41
41 -
 42
42 -
 43
43 -
 44
44 -
 45
45 -
 46
46 -
 47
47 -
48
-
49
-
50
-
51
-
52
-
53
-
54
-
55
-
56
-
57
-
58
-
59
-
60
-
61
-
62
-
63
-
64
-
65
-
66
-
67
-
68
-
69
-
70
-
71
-
72
-
73
-
74
-
75
-
76
-
77
-
78
-
79
-
80
-
81
-
82
-
83
-
84
-
85
-
86
-
87
-
88
-
89
-
90
-
91
-
92
-
93
-
94
 |
 |

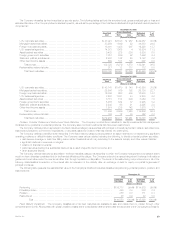
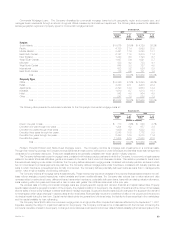
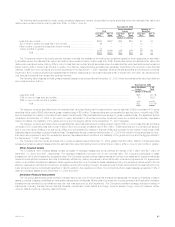
Commercial Mortgage Loans. The Company diversifies its commercial mortgage loans by both geographic region and property type, and
manages these investments through a network of regional offices overseen by its investment department. The following table presents the distribution
across geographic regions and property types for commercial mortgage loans at:
December 31,
2002 2001
Carrying % of Carrying % of
Value Total Value Total
(Dollars in millions)
Region
South Atlantic ******************************************************************* $ 5,076 26.0% $ 4,729 26.3%
Pacific************************************************************************** 4,180 21.4 3,593 20.0
Middle Atlantic ******************************************************************* 3,441 17.6 3,248 18.1
East North Central**************************************************************** 2,147 11.0 2,003 11.2
New England ******************************************************************** 1,323 6.8 1,198 6.7
West South Central*************************************************************** 1,097 5.6 1,021 5.7
Mountain *********************************************************************** 833 4.2 733 4.1
West North Central *************************************************************** 645 3.3 727 4.0
International ********************************************************************* 632 3.2 526 2.9
East South Central *************************************************************** 178 0.9 181 1.0
Total ******************************************************************* $19,552 100.0% $17,959 100.0%
Property Type
Office ************************************************************************** $ 9,340 47.8% $ 8,293 46.2%
Retail*************************************************************************** 4,320 22.1 4,208 23.4
Apartments********************************************************************** 2,793 14.3 2,553 14.2
Industrial ************************************************************************ 1,910 9.7 1,813 10.1
Hotel*************************************************************************** 942 4.8 864 4.8
Other ************************************************************************** 247 1.3 228 1.3
Total ******************************************************************* $19,552 100.0% $17,959 100.0%
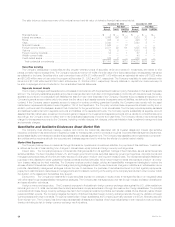
The following table presents the scheduled maturities for the Company’s commercial mortgage loans at:
December 31,
2002 2001
Carrying % of Carrying % of
Value Total Value Total
(Dollars in millions)
Due in one year or less *********************************************************** $ 713 3.6% $ 840 4.7%
Due after one year through two years *********************************************** 1,204 6.2 677 3.8
Due after two years through three years ********************************************* 1,939 9.9 1,532 8.5
Due after three years through four years ********************************************* 2,048 10.5 1,772 9.9
Due after four years through five years *********************************************** 2,443 12.5 2,078 11.6
Due after five years *************************************************************** 11,205 57.3 11,060 61.5
Total ******************************************************************* $19,552 100.0% $17,959 100.0%
Problem, Potential Problem and Restructured Mortgage Loans. The Company monitors its mortgage loan investments on a continual basis.
Through this monitoring process, the Company reviews loans that are restructured, delinquent or under foreclosure and identifies those that management
considers to be potentially delinquent. These loan classifications are generally consistent with those used in industry practice.
The Company defines restructured mortgage loans, consistent with industry practice, as loans in which the Company, for economic or legal reasons
related to the debtor’s financial difficulties, grants a concession to the debtor that it would not otherwise consider. This definition provides for loans to exit
the restructured category under certain conditions. The Company defines delinquent mortgage loans, consistent with industry practice, as loans in which
two or more interest or principal payments are past due. The Company defines mortgage loans under foreclosure, consistent with industry practice, as
loans in which foreclosure proceedings have formally commenced. The Company defines potentially delinquent loans as loans that, in management’s
opinion, have a high probability of becoming delinquent.
The Company reviews all mortgage loans at least annually. These reviews may include an analysis of the property financial statements and rent roll,
lease rollover analysis, property inspections, market analysis and tenant creditworthiness. The Company also reviews loan-to-value ratios and debt
coverage ratios for restructured loans, delinquent loans, loans under foreclosure, potentially delinquent loans, loans with an existing valuation allowance,
loans maturing within two years and loans with a loan-to-value ratio greater than 90% as determined in the prior year.
The principal risks in holding commercial mortgage loans are property specific, supply and demand, financial and capital market risks. Property
specific risks include the geographic location of the property, the physical condition of the property, the diversity of tenants and the rollover of their leases
and the ability of the property manager to attract tenants and manage expenses. Supply and demand risks include changes in the supply and/or demand
for rental space which cause changes in vacancy rates and/or rental rates. Financial risks include the overall level of debt on the property and the amount
of principal repaid during the loan term. Capital market risks include the general level of interest rates, the liquidity for these securities in the marketplace
and the capital available for loan refinancing.
The Company has a $525 million non-recourse mortgage loan on a high profile office complex that has been affected by the September 11, 2001
tragedies, causing the obligor to impair its investment in the property. The Company continues to be in discussions with the borrower concerning the
borrower’s ownership interest in the property. A change in circumstances could result in a borrower default, MetLife classifying the loan as impaired or the
MetLife, Inc. 33