MetLife 2002 Annual Report Download - page 33
Download and view the complete annual report
Please find page 33 of the 2002 MetLife annual report below. You can navigate through the pages in the report by either clicking on the pages listed below, or by using the keyword search tool below to find specific information within the annual report.-
 1
1 -
2
-
3
-
4
-
5
-
6
-
7
-
8
-
9
-
10
-
11
-
12
-
13
-
14
-
15
-
16
-
17
-
18
-
19
-
20
-
21
-
22
-
 23
23 -
 24
24 -
 25
25 -
 26
26 -
 27
27 -
 28
28 -
 29
29 -
 30
30 -
 31
31 -
 32
32 -
 33
33 -
 34
34 -
 35
35 -
 36
36 -
 37
37 -
 38
38 -
 39
39 -
 40
40 -
 41
41 -
 42
42 -
 43
43 -
44
-
45
-
46
-
47
-
48
-
49
-
50
-
51
-
52
-
53
-
54
-
55
-
56
-
57
-
58
-
59
-
60
-
61
-
62
-
63
-
64
-
65
-
66
-
67
-
68
-
69
-
70
-
71
-
72
-
73
-
74
-
75
-
76
-
77
-
78
-
79
-
80
-
81
-
82
-
83
-
84
-
85
-
86
-
87
-
88
-
89
-
90
-
91
-
92
-
93
-
94
 |
 |

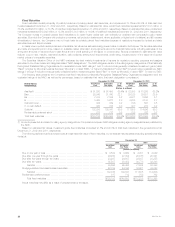
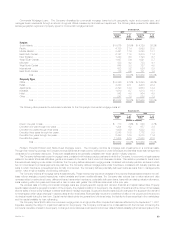
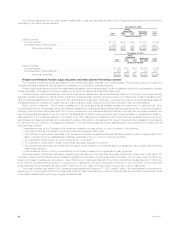
The Company diversifies its fixed maturities by security sector. The following tables set forth the amortized cost, gross unrealized gain or loss and
estimated fair value of the Company’s fixed maturities by sector, as well as the percentage of the total fixed maturities holdings that each security sector is
comprised at:
December 31, 2002
Gross Unrealized
Amortized Estimated % of
Cost Gain Loss Fair Value Total
(Dollars in millions)
U.S. corporate securities************************************************* $ 47,021 $3,193 $ 957 $ 49,257 35.0%
Mortgage-backed securities ********************************************** 33,256 1,649 22 34,883 24.8
Foreign corporate securities ********************************************** 18,001 1,435 207 19,229 13.7
U.S. treasuries/agencies ************************************************* 14,373 1,565 4 15,934 11.3
Asset-backed securities ************************************************* 9,483 228 208 9,503 6.8
Foreign government securities ******************************************** 7,012 636 52 7,596 5.4
State and political subdivisions ******************************************** 2,580 182 20 2,742 2.0
Other fixed income assets *********************************************** 609 191 103 697 0.5
Total bonds ******************************************************** 132,335 9,079 1,573 139,841 99.5
Redeemable preferred stocks********************************************* 817 12 117 712 0.5
Total fixed maturities************************************************* $133,152 $9,091 $1,690 $140,553 100.0%
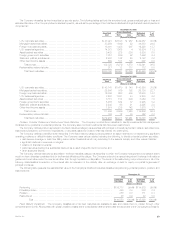
December 31, 2001
Gross Unrealized
Amortized Estimated % of
Cost Gain Loss Fair Value Total
(Dollars in millions)
U.S. corporate securities************************************************* $ 43,141 $1,470 $ 748 $ 43,863 38.0%
Mortgage-backed securities ********************************************** 25,506 866 192 26,180 22.7
Foreign corporate securities ********************************************** 16,836 688 539 16,985 14.7
U.S. treasuries/agencies ************************************************* 8,297 1,031 43 9,285 8.0
Asset-backed securities ************************************************* 8,115 154 206 8,063 7.0
Foreign government securities ******************************************** 5,488 544 37 5,995 5.2
State and political subdivisions ******************************************** 2,248 68 21 2,295 2.0
Other fixed income assets *********************************************** 1,874 238 142 1,970 1.7
Total bonds ******************************************************** 111,505 5,059 1,928 114,636 99.3
Redeemable preferred stocks********************************************* 783 12 33 762 0.7
Total fixed maturities************************************************* $112,288 $5,071 $1,961 $115,398 100.0%
Problem, Potential Problem and Restructured Fixed Maturities. The Company monitors fixed maturities to identify investments that management
considers to be problems or potential problems. The Company also monitors investments that have been restructured.
The Company defines problem securities in the fixed maturities category as securities with principal or interest payments in default, securities to be
restructured pursuant to commenced negotiations, or securities issued by a debtor that has entered into bankruptcy.
The Company defines potential problem securities in the fixed maturity category as securities of an issuer deemed to be experiencing significant
operating problems or difficult industry conditions. The Company uses various criteria, including the following, to identify potential problem securities:
)debt service coverage or cash flow falling below certain thresholds which vary according to the issuer’s industry and other relevant factors;
)significant declines in revenues or margins;
)violation of financial covenants;
)public securities trading at a substantial discount as a result of specific credit concerns; and
)other subjective factors.
The Company defines restructured securities in the fixed maturities category as securities to which the Company has granted a concession that it
would not have otherwise considered but for the financial difficulties of the obligor. The Company enters into a restructuring when it believes it will realize a
greater economic value under the new terms rather than through liquidation or disposition. The terms of the restructuring may involve some or all of the
following characteristics: a reduction in the interest rate, an extension of the maturity date, an exchange of debt for equity or a partial forgiveness of
principal or interest.
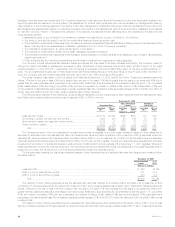
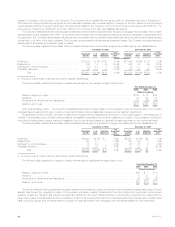
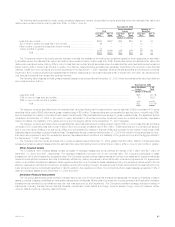
The following table presents the estimated fair value of the Company’s total fixed maturities classified as performing, potential problem, problem and
restructured at:
December 31,
2002 2001
Estimated % of Estimated % of
Fair Value Total Fair Value Total
(Dollars in millions)
Performing *********************************************************************** $139,717 99.4% $114,879 99.6%
Potential problem ***************************************************************** 450 0.3 386 0.3
Problem ************************************************************************* 358 0.3 111 0.1
Restructured ********************************************************************* 28 0.0 22 0.0
Total ******************************************************************** $140,553 100.0% $115,398 100.0%
Fixed Maturity Impairment. The Company classifies all of its fixed maturities as available-for-sale and marks them to market through other
comprehensive income. All securities with gross unrealized losses at the consolidated balance sheet date are subjected to the Company’s process for
MetLife, Inc. 29