MetLife 2002 Annual Report Download - page 34
Download and view the complete annual report
Please find page 34 of the 2002 MetLife annual report below. You can navigate through the pages in the report by either clicking on the pages listed below, or by using the keyword search tool below to find specific information within the annual report.-
 1
1 -
2
-
3
-
4
-
5
-
6
-
7
-
8
-
9
-
10
-
11
-
12
-
13
-
14
-
15
-
16
-
17
-
18
-
19
-
20
-
21
-
22
-
23
-
 24
24 -
 25
25 -
 26
26 -
 27
27 -
 28
28 -
 29
29 -
 30
30 -
 31
31 -
 32
32 -
 33
33 -
 34
34 -
 35
35 -
 36
36 -
 37
37 -
 38
38 -
 39
39 -
 40
40 -
 41
41 -
 42
42 -
 43
43 -
 44
44 -
45
-
46
-
47
-
48
-
49
-
50
-
51
-
52
-
53
-
54
-
55
-
56
-
57
-
58
-
59
-
60
-
61
-
62
-
63
-
64
-
65
-
66
-
67
-
68
-
69
-
70
-
71
-
72
-
73
-
74
-
75
-
76
-
77
-
78
-
79
-
80
-
81
-
82
-
83
-
84
-
85
-
86
-
87
-
88
-
89
-
90
-
91
-
92
-
93
-
94
 |
 |

identifying other-than-temporary impairments. The Company writes down to fair value securities that it deems to be other-than-temporarily impaired in the
period the securities are deemed to be so impaired. The assessment of whether such impairment has occurred is based on management’s case-by-
case evaluation of the underlying reasons for the decline in fair value. Management considers a wide range of factors, as described below, about the
security issuer and uses its best judgment in evaluating the cause of the decline in the estimated fair value of the security and in assessing the prospects
for near-term recovery. Inherent in management’s evaluation of the security are assumptions and estimates about the operations of the issuer and its
future earnings potential.
Considerations used by the Company in the impairment evaluation process include, but are not limited to, the following:
)The length of time and the extent to which the market value has been below amortized cost;
)The potential for impairments of securities when the issuer is experiencing significant financial difficulties, including a review of all securities of the
issuer, including its known subsidiaries and affiliates, regardless of the form of the Company’s ownership;
)The potential for impairments in an entire industry sector or sub-sector;
)The potential for impairments in certain economically depressed geographic locations;
)The potential for impairments of securities where the issuer, series of issuers or industry has suffered a catastrophic type of loss or has exhausted
natural resources; and
)Other subjective factors, including concentrations and information obtained from regulators and rating agencies.
The Company records writedowns as investment losses and adjusts the cost basis of the fixed maturities accordingly. The Company does not
change the revised cost basis for subsequent recoveries in value. Writedowns of fixed maturities were $1,264 million and $273 million for the years
ended December 31, 2002 and 2001, respectively. The Company’s three largest writedowns totaled $352 million for the year ended December 31,
2002. The circumstances that gave rise to these impairments were financial restructurings or bankruptcy filings. During the year ended December 31,
2002, the Company sold fixed maturity securities with a fair value of $14,597 million at a loss of $894 million.
The gross unrealized loss related to the Company’s fixed maturities at December 31, 2002 was $1,690 million. These fixed maturities mature as
follows: 17% due in one year or less; 19% due in greater than one year to five years; 18% due in greater than five years to ten years; and 46% due in
greater than ten years (calculated as a percentage of amortized cost). Additionally, such securities are concentrated by security type in U.S. corporates
(57%), asset-backed (12%) and foreign corporates (12%); and are concentrated by industry in utilities (20%), finance (18%), transportation (12%) and
communications (10%) (calculated as a percentage of gross unrealized loss). Non-investment grade securities represent 23% of the $23,402 million of
the fair value and 48% of the $1,690 million gross unrealized loss on fixed maturities.
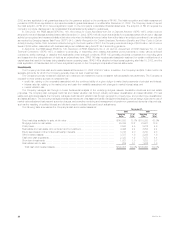
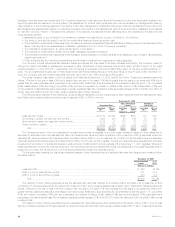
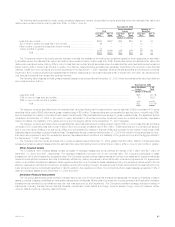
The following table presents the amortized cost, gross unrealized losses and number of securities for fixed maturities where the estimated fair value
had declined and remained below amortized cost by less than 20%, or 20% or more for:
December 31, 2002
Gross Unrealized Number of
Amortized Cost Losses Securities
Less than 20% or Less than 20% or Less than 20% or
20% More 20% More 20% More
(Dollars in millions)
Less than six months********************************************* $16,733 $1,622 $569 $531 791 160
Six months or greater but less than nine months********************** 1,008 433 53 156 91 25
Nine months or greater but less than twelve months******************* 3,212 87 175 31 170 11
Twelve months or greater ***************************************** 1,885 112 128 47 170 21
Total ******************************************************* $22,838 $2,254 $925 $765 1,222 217
The Company’s review of its fixed maturities for impairments includes an analysis of the total gross unrealized losses by three categories of
securities: (i) securities where the estimated fair value had declined and remained below amortized cost by less than 20%; (ii) securities where the
estimated fair value had declined and remained below amortized cost by 20% or more for less than six months; and (iii) securities where the estimated
value had declined and remained below amortized cost by 20% or more for six months or greater. The first two categories have generally been adversely
impacted by the downturn in the financial markets, overall economic conditions and continuing effects of the September 11, 2001 tragedies. While all of
these securities are monitored for potential impairment, the Company’s experience indicates that the first two categories do not present as great a risk of
impairment, and often, fair values recover over time as the factors that caused the declines improve.
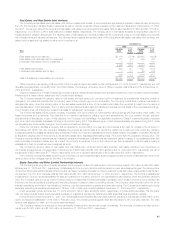
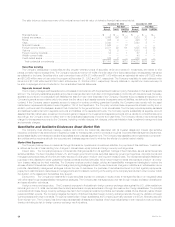
The following table presents the total gross unrealized losses for fixed maturities where the estimated fair value had declined and remained below
amortized cost by:
December 31, 2002
Gross unrealized % of
losses Total
(Dollars in millions)
Less than 20% ********************************************************************************** $ 925 54.7%
20% or more for less than six months *************************************************************** 531 31.4
20% or more for six months or greater*************************************************************** 234 13.9
Total *************************************************************************************** $1,690 100.0%
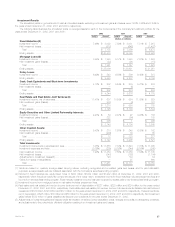
The category of fixed maturity securities where the estimated fair value has declined and remained below amortized cost by less than 20% is
comprised of 1,222 securities with an amortized cost of $22,838 million and a gross unrealized loss of $925 million. These fixed maturities mature as
follows: 19% due in one year or less; 19% due in greater than one year to five years; 17% due in greater than five years to ten years; and 45% due in
greater than ten years (calculated as a percentage of amortized cost). Additionally, such securities are concentrated by security type in U.S. corporates
(51%) and foreign corporates (17%); and are concentrated by industry in finance (28%), utilities (14%) and communications (11%) (calculated as a
percentage of gross unrealized loss). Non-investment grade securities represent 21% of the $21,913 million fair value and 33% of the $925 million gross
unrealized loss.
The category of fixed maturity securities where the estimated fair value has declined and remained below amortized cost by 20% or more for less
than six months is comprised of 160 securities with an amortized cost of $1,622 million and a gross unrealized loss of $531 million. These fixed maturities
MetLife, Inc.
30