MetLife 2002 Annual Report Download - page 22
Download and view the complete annual report
Please find page 22 of the 2002 MetLife annual report below. You can navigate through the pages in the report by either clicking on the pages listed below, or by using the keyword search tool below to find specific information within the annual report.-
 1
1 -
2
-
3
-
4
-
5
-
6
-
7
-
8
-
9
-
10
-
11
-
 12
12 -
 13
13 -
 14
14 -
 15
15 -
 16
16 -
 17
17 -
 18
18 -
 19
19 -
 20
20 -
 21
21 -
 22
22 -
 23
23 -
 24
24 -
 25
25 -
 26
26 -
 27
27 -
 28
28 -
 29
29 -
 30
30 -
 31
31 -
 32
32 -
33
-
34
-
35
-
36
-
37
-
38
-
39
-
40
-
41
-
42
-
43
-
44
-
45
-
46
-
47
-
48
-
49
-
50
-
51
-
52
-
53
-
54
-
55
-
56
-
57
-
58
-
59
-
60
-
61
-
62
-
63
-
64
-
65
-
66
-
67
-
68
-
69
-
70
-
71
-
72
-
73
-
74
-
75
-
76
-
77
-
78
-
79
-
80
-
81
-
82
-
83
-
84
-
85
-
86
-
87
-
88
-
89
-
90
-
91
-
92
-
93
-
94
 |
 |

personal umbrella claims. Fluctuations in these policyholder benefits and claims may not be commensurate with the change in premiums for a given
period due to low premium volume and high liability limits.
Other expenses decreased by $27 million, or 3%, to $800 million for the year ended December 31, 2001 from $827 million for the comparable
2000 period. This decrease is due to a reduction in integration costs associated with the St. Paul acquisition.
The effective income tax rates for the years ended December 31, 2001 and 2000 differ from the federal corporate tax rate of 35% due to the impact
of non-taxable investment income.
Asset Management
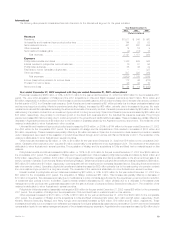
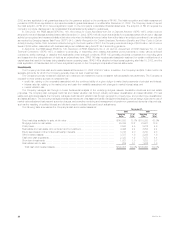
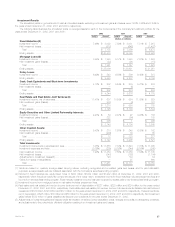
The following table presents consolidated financial information for the Asset Management segment for the years indicated:
Year Ended December 31,
2002 2001 2000
(Dollars in millions)
Revenues
Net investment income ******************************************************************** $59 $71 $90
Other revenues ************************************************************************** 166 198 760
Net investment (losses) gains ************************************************************** (4) 25 —
Total revenues *********************************************************************** 221 294 850
Other Expenses ************************************************************************ 211 252 749
Income before provision for income taxes and minority interest*********************************** 10 42 101
Provision for income taxes ***************************************************************** 41532
Minority interest ************************************************************************** ——35
Net income ***************************************************************************** $6 $27 $34
Year ended December 31, 2002 compared with the year ended December 31, 2001—Asset Management
Other revenues, which primarily consist of management and advisory fees from third parties, decreased by $32 million, or 16%, to $166 million for
the year ended December 31, 2002 from $198 million for the comparable 2001 period. The most significant factor contributing to this decline is a
$31 million decrease resulting from the sale of Conning, which occurred in July 2001. Excluding the impact of this transaction, other revenues remained
essentially unchanged at $166 million for the year ended December 31, 2002 as compared to $167 million for the year ended December 31, 2001.
Despite lower average assets under management, revenues remained constant due to performance and incentive fees earned on certain real estate and
hedge fund products. The lower assets under management are primarily due to institutional client withdrawals, and the downturn in the equity market. In
addition, fourth quarter 2002 product closings and business exits also contributed to this decline.
Other expenses decreased by $41 million, or 16%, to $211 million for the year ended December 31, 2002 from $252 million for the comparable
2001 period. Excluding the impact of the sale of Conning, other expenses decreased by $6 million, or 3%, to $211 million in 2002 from $217 million in
2001. This decrease is due to reductions in marketing-related expenses and expenses related to fund reimbursements. In addition, a decrease in
amortization of deferred sales commissions resulted from a reduction in sales. These decreases were partially offset by a $5 million increase in employee
compensation attributable to severance-related expenses resulting from third and fourth quarter 2002 staff reductions.
Year ended December 31, 2001 compared with the year ended December 31, 2000—Asset Management
Other revenues, which are primarily comprised of management and advisory fees from third parties, decreased by $562 million, or 74%, to
$198 million in 2001 from $760 million in 2000. The most significant factors contributing to this decline were a $522 million decrease resulting from the
sale of Nvest, which occurred in October 2000, and a $48 million decrease resulting from the sale of Conning, which occurred in July 2001. Excluding
the impact of these transactions, other revenues increased by $8 million, or 5%, to $167 million in 2001 from $159 million in 2000. This is attributable to
an increase in real estate assets under management that command a higher fee. Assets under management in the remaining Asset Management
organization decreased from $56 billion as of December 31, 2000 to $51 billion at December 31, 2001. The decline occurred as a result of the equity
market downturn and MetLife institutional customer withdrawals. Third party assets under management registered only a slight decrease of $352 million
as a result of the equity market downturn, substantially offset by strong mutual fund sales and the purchase of a real estate portfolio in the second quarter
of 2001 comprised of new assets of $1.7 billion. Management and advisory fees are typically calculated based on a percentage of assets under
management, and are not necessarily proportionate to average assets managed due to changes in account mix.
Other expenses decreased by $497 million, or 66%, to $252 million in 2001 from $749 million in 2000. The sale of Nvest reduced other expenses
by $457 million and the sale of Conning reduced other expenses by $55 million. Excluding the impact of these transactions, other expenses increased
by $15 million, or 7%, to $217 million in 2001 from $202 million in 2000. This variance is attributable to an increase in total compensation and benefits
and an increase in discretionary spending. Compensation and benefits expense totaled $111 million in 2001 and is comprised of approximately 63%
base compensation and 37% variable compensation. Base compensation increased by $9 million, or 15%, to $70 million in 2001 from $61 million in
2000, primarily due to higher staffing levels. Variable compensation decreased by $1 million, or 2%, to $41 million in 2001 from $42 million in 2000 due to
lower profitability. Variable incentive payments are based upon profitability, investment portfolio performance, new business sales and growth in revenues
and profits. The variable compensation plans reward the employees for growth in their businesses, but also require them to share in the impact of any
declines. Increased sales commissions arising from higher mutual fund sales in 2001 were largely offset by downward revisions in other variable
compensation due to a decline in profits. Other general and administrative expenses increased $7 million, or 7%, to $106 million in 2001 from $99 million
in 2000, primarily due to increases in occupancy costs and increased mutual fund reimbursement subsidies.
Minority interest, principally reflecting third-party ownership interest in Nvest, decreased by $35 million, or 100%, due to the sale of Nvest.
MetLife, Inc.
18