MetLife 2002 Annual Report Download - page 21
Download and view the complete annual report
Please find page 21 of the 2002 MetLife annual report below. You can navigate through the pages in the report by either clicking on the pages listed below, or by using the keyword search tool below to find specific information within the annual report.-
 1
1 -
2
-
3
-
4
-
5
-
6
-
7
-
8
-
9
-
10
-
 11
11 -
 12
12 -
 13
13 -
 14
14 -
 15
15 -
 16
16 -
 17
17 -
 18
18 -
 19
19 -
 20
20 -
 21
21 -
 22
22 -
 23
23 -
 24
24 -
 25
25 -
 26
26 -
 27
27 -
 28
28 -
 29
29 -
 30
30 -
 31
31 -
32
-
33
-
34
-
35
-
36
-
37
-
38
-
39
-
40
-
41
-
42
-
43
-
44
-
45
-
46
-
47
-
48
-
49
-
50
-
51
-
52
-
53
-
54
-
55
-
56
-
57
-
58
-
59
-
60
-
61
-
62
-
63
-
64
-
65
-
66
-
67
-
68
-
69
-
70
-
71
-
72
-
73
-
74
-
75
-
76
-
77
-
78
-
79
-
80
-
81
-
82
-
83
-
84
-
85
-
86
-
87
-
88
-
89
-
90
-
91
-
92
-
93
-
94
 |
 |

and certain cash-value contracts. The increase is primarily related to an increase in the underlying account balances due to a new block of single
premium deferred annuities reinsured in 2001. Additionally, the crediting rate on certain blocks of annuities is based on the performance of the underlying
assets. Therefore, any fluctuations in interest credited related to these blocks are generally offset by a corresponding change in net investment income.
Policyholder dividends were essentially unchanged at $24 million for the year ended December 31, 2001 as compared to $21 million for the year
ended December 31, 2000.
Other expenses decreased by $7 million, or 2%, to $439 million for the year ended December 31, 2001 from $446 million for the comparable 2000
period. Other expenses, which include underwriting, acquisition and insurance expenses, were 20% of segment revenues in 2001 compared with 24%
in 2000. This percentage fluctuates depending on the mix of the underlying insurance products being reinsured.
Minority interest reflects third-party ownership interests in RGA.
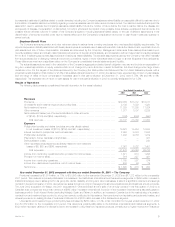
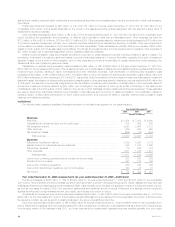
Auto & Home
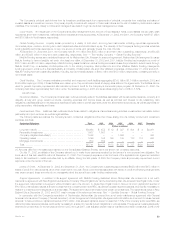
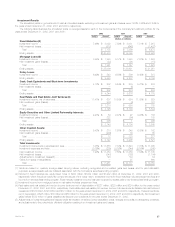
The following table presents consolidated financial information for the Auto & Home segment for the years indicated:
Year Ended December 31,
2002 2001 2000
(Dollars in millions)
Revenues
Premiums ************************************************************************** $2,828 $2,755 $2,636
Net investment income *************************************************************** 177 200 194
Other revenues ********************************************************************* 26 22 40
Net investment losses**************************************************************** (46) (17) (20)
Total revenues ****************************************************************** 2,985 2,960 2,850
Expenses
Policyholder benefits and claims ******************************************************* 2,019 2,121 2,005
Other expenses ********************************************************************* 793 800 827
Total expenses****************************************************************** 2,812 2,921 2,832
Income before provision (benefit) for income taxes **************************************** 173 39 18
Provision (benefit) for income taxes ***************************************************** 41 (2) (12)
Net income ************************************************************************ $ 132 $ 41 $ 30
Year ended December 31, 2002 compared with the year ended December 31, 2001—Auto & Home
Premiums increased by $73 million, or 3%, to $2,828 million for the year ended December 31, 2002 from $2,755 million for the comparable 2001
period. Auto and property premiums increased by $66 million and $1 million, respectively, primarily due to increases in average premium earned per
policy resulting from rate increases. The impact on premiums from rate increases was partially offset by an expected reduction in retention and a
reduction in new business sales. Premiums from other personal lines increased by $6 million.
Other revenues increased by $4 million, or 18%, to $26 million for the year ended December 31, 2002 from $22 million for the comparable 2001
period. This increase was primarily due to income earned on a COLI policy purchased in the second quarter of 2002, as well as higher fees on
installment payments. These increases were partially offset by an adjustment to a deferred gain related to the disposition of this segment’s reinsurance
business in 1990.
Policyholder benefits and claims decreased by $102 million, or 5%, to $2,019 million for the year ended December 31, 2002 from $2,121 million for
the comparable 2001 period. Property policyholder benefits and claims decreased by $120 million due to improved claim frequency, underwriting and
agency management actions, and a $41 million reduction in catastrophe losses. Property catastrophes represented 7.4% of the property loss ratio in
2002 compared to 13.5% in 2001. Other policyholder benefits and claims decreased by $10 million due to fewer personal umbrella claims. Fluctuations
in these policyholder benefits and claims may not be commensurate with the change in premiums for a given period due to low premium volume and high
liability limits. Auto policyholder benefits and claims increased by $28 million largely due to an increase in current year bodily injury and no-fault severities.
Costs associated with the processing of the New York assigned risk business also contributed to this increase. These increases were partially offset by
improved claim frequency resulting from milder winter weather, underwriting and agency management actions, as well as lower catastrophe losses.
Other expenses decreased by $7 million, or 1%, to $793 million for the year ended December 31, 2002 from $800 million for the comparable 2001
period. This decrease is primarily due to reduced employee head-count and reduced expenses associated with the consolidation of The St. Paul
companies acquired in 1999. These declines are partially offset by an increase in expenses related to the outsourced New York assigned risk business.
The effective income tax rates for the year ended December 31, 2002 and 2001 differ from the federal corporate tax rate of 35% due to the impact
of non-taxable investment income.
Year ended December 31, 2001 compared with the year ended December 31, 2000—Auto & Home
Premiums increased by $119 million, or 5%, to $2,755 million for the year ended December 31, 2001 from $2,636 million for the comparable 2000
period. Auto premiums increased by $99 million. Property premiums increased by $17 million. Both increases were largely due to rate increases. Due to
increased rate activity, the retention ratio for the existing business declined from 90% to 89%. Premiums from other personal lines increased by $3 million.
Other revenues decreased by $18 million, or 45%, to $22 million for the year ended December 31, 2001 from $40 million for the comparable 2000
period. This decrease is primarily due to a revision of an estimate made in 2000 of amounts recoverable from reinsurers related to the disposition of this
segment’s reinsurance business in 1990.
Policyholder benefits and claims increased by $116 million, or 6%, to $2,121 million for the year ended December 31, 2001 from $2,005 million for
the comparable 2000 period. Auto policyholder benefits and claims increased by $62 million due to increased average claim costs, growth in the
business and adverse weather in the first quarter of 2001. Despite this increase, the auto loss ratio decreased to 75.9% in 2001 from 76.6% in 2000 as a
result of higher premiums per policy. Property policyholder benefits and claims increased by $41 million due to increased non-catastrophe weather-
related losses in 2001. Correspondingly, the property loss ratio increased to 80.7% in 2001 from 76.4% in 2000. Catastrophes represented 13.5% of
the loss ratio in 2001 compared to 17.3% in 2000. Other policyholder benefits and claims grew by $13 million, primarily due to an increase in high liability
MetLife, Inc. 17