MetLife 2002 Annual Report Download - page 69
Download and view the complete annual report
Please find page 69 of the 2002 MetLife annual report below. You can navigate through the pages in the report by either clicking on the pages listed below, or by using the keyword search tool below to find specific information within the annual report.-
 1
1 -
2
-
3
-
4
-
5
-
6
-
7
-
8
-
9
-
10
-
11
-
12
-
13
-
14
-
15
-
16
-
17
-
18
-
19
-
20
-
21
-
22
-
23
-
24
-
25
-
26
-
27
-
28
-
29
-
30
-
31
-
32
-
33
-
34
-
35
-
36
-
37
-
38
-
39
-
40
-
41
-
42
-
43
-
44
-
45
-
46
-
47
-
48
-
49
-
50
-
51
-
52
-
53
-
54
-
55
-
56
-
57
-
58
-
 59
59 -
 60
60 -
 61
61 -
 62
62 -
 63
63 -
 64
64 -
 65
65 -
 66
66 -
 67
67 -
 68
68 -
 69
69 -
 70
70 -
 71
71 -
 72
72 -
 73
73 -
 74
74 -
 75
75 -
 76
76 -
 77
77 -
 78
78 -
 79
79 -
80
-
81
-
82
-
83
-
84
-
85
-
86
-
87
-
88
-
89
-
90
-
91
-
92
-
93
-
94
 |
 |

METLIFE, INC.
NOTES TO CONSOLIDATED FINANCIAL STATEMENTS — (Continued)
losses of $142 million relating to the effective portion of cash flow hedges. During the year ended December 31, 2002, $10 million of other
comprehensive income and $57 million of other comprehensive losses were reclassified into net investment income and net investment losses,
respectively. During the year ended December 31, 2001, $19 million of other comprehensive income was reclassified into net investment income due to
the SFAS 133 transition adjustment. Approximately $6 million and $12 million of the losses reported in accumulated other comprehensive income at
December 31, 2002 are expected to be reclassified during the year ending December 31, 2003 into net investment income and net investment gains
and losses, respectively, as the underlying investments mature or expire according to their original terms.
For the years ended December 31, 2002 and 2001, the Company recognized net investment income of $32 million and $24 million, respectively,
and net investment losses of $172 million and net investment gains of $100 million, respectively, from derivatives not qualifying as accounting hedges.
The use of these non-speculative derivatives is permitted by the Department.
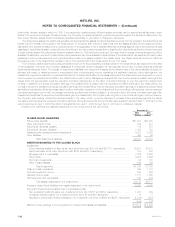
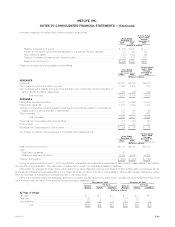
5. Fair Value Information
The estimated fair values of financial instruments have been determined by using available market information and the valuation methodologies
described below. Considerable judgment is often required in interpreting market data to develop estimates of fair value. Accordingly, the estimates
presented herein may not necessarily be indicative of amounts that could be realized in a current market exchange. The use of different assumptions or
valuation methodologies may have a material effect on the estimated fair value amounts.
Amounts related to the Company’s financial instruments were as follows:
Notional Carrying Estimated
Amount Value Fair Value
(Dollars in millions)
December 31, 2002
Assets:
Fixed maturities********************************************************************** $140,553 $140,553
Equity securities ********************************************************************* $ 1,348 $ 1,348
Mortgage loans on real estate ********************************************************* $ 25,086 $ 27,778
Policy loans************************************************************************* $ 8,580 $ 8,580
Short-term investments *************************************************************** $ 1,921 $ 1,921
Cash and cash equivalents************************************************************ $ 2,323 $ 2,323
Mortgage loan commitments*********************************************************** $ 859 $ — $ 12
Commitments to fund partnership investments ******************************************** $1,667 $ — $ —
Liabilities:
Policyholder account balances ********************************************************* $ 55,285 $ 55,909
Short-term debt ********************************************************************* $ 1,161 $ 1,161
Long-term debt********************************************************************** $ 4,425 $ 4,731
Payable under securities loaned transactions ********************************************* $ 17,862 $ 17,862
Other:
Company-obligated mandatorily redeemable securities of subsidiary trusts********************* $ 1,265 $ 1,337
Notional Carrying Estimated
Amount Value Fair Value
(Dollars in millions)
December 31, 2001
Assets:
Fixed maturities********************************************************************** $115,398 $115,398
Equity securities ********************************************************************* $ 3,063 $ 3,063
Mortgage loans on real estate ********************************************************* $ 23,621 $ 24,844
Policy loans************************************************************************* $ 8,272 $ 8,272
Short-term investments *************************************************************** $ 1,203 $ 1,203
Cash and cash equivalents************************************************************ $ 7,473 $ 7,473
Mortgage loan commitments*********************************************************** $ 532 $ — $ (4)
Commitments to fund partnership investments ******************************************** $1,898 $ — $ —
Liabilities:
Policyholder account balances ********************************************************* $ 47,977 $ 48,318
Short-term debt ********************************************************************* $ 355 $ 355
Long-term debt********************************************************************** $ 3,628 $ 3,685
Payable under securities loaned transactions ********************************************* $ 12,661 $ 12,661
Other:
Company-obligated mandatorily redeemable securities of subsidiary trusts********************* $ 1,256 $ 1,311
The methods and assumptions used to estimate the fair values of financial instruments are summarized as follows:
Fixed Maturities and Equity Securities
The fair value of fixed maturities and equity securities are based upon quotations published by applicable stock exchanges or received from
other reliable sources. For securities for which the market values were not readily available, fair values were estimated using quoted market prices of
comparable investments.
MetLife, Inc. F-25