MetLife 2002 Annual Report Download - page 85
Download and view the complete annual report
Please find page 85 of the 2002 MetLife annual report below. You can navigate through the pages in the report by either clicking on the pages listed below, or by using the keyword search tool below to find specific information within the annual report.-
 1
1 -
2
-
3
-
4
-
5
-
6
-
7
-
8
-
9
-
10
-
11
-
12
-
13
-
14
-
15
-
16
-
17
-
18
-
19
-
20
-
21
-
22
-
23
-
24
-
25
-
26
-
27
-
28
-
29
-
30
-
31
-
32
-
33
-
34
-
35
-
36
-
37
-
38
-
39
-
40
-
41
-
42
-
43
-
44
-
45
-
46
-
47
-
48
-
49
-
50
-
51
-
52
-
53
-
54
-
55
-
56
-
57
-
58
-
59
-
60
-
61
-
62
-
63
-
64
-
65
-
66
-
67
-
68
-
69
-
70
-
71
-
72
-
73
-
74
-
 75
75 -
 76
76 -
 77
77 -
 78
78 -
 79
79 -
 80
80 -
 81
81 -
 82
82 -
 83
83 -
 84
84 -
 85
85 -
 86
86 -
 87
87 -
 88
88 -
 89
89 -
 90
90 -
 91
91 -
 92
92 -
 93
93 -
 94
94
 |
 |

METLIFE, INC.
NOTES TO CONSOLIDATED FINANCIAL STATEMENTS — (Continued)
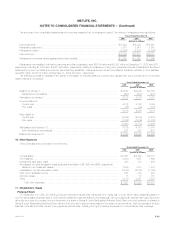
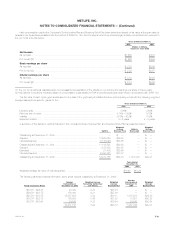
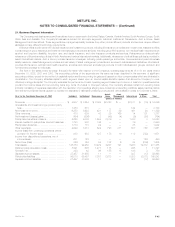
Had compensation cost for the Company’s Stock Incentive Plan and Directors Stock Plan been determined based on fair value at the grant date for
awards under those plans consistent with the method of SFAS No. 123, the Company’s net income and earnings per share would have been reduced to
the pro forma amounts below:
Years Ended December 31,
2002 2001
(Dollars in millions,
except per share data)
Net Income
As reported******************************************************************************** $1,605 $ 473
Pro forma(1)(2) ***************************************************************************** $1,563 $ 454
Basic earnings per share
As reported******************************************************************************** $ 2.28 $0.64
Pro forma(1)(2) ***************************************************************************** $ 2.22 $0.61
Diluted earnings per share
As reported******************************************************************************** $ 2.20 $0.62
Pro forma(1)(2) ***************************************************************************** $ 2.14 $0.59
(1) The pro forma earnings disclosures are not necessarily representative of the effects on net income and earnings per share in future years.
(2) Includes the Company’s ownership share of compensation costs related to RGA’s incentive stock plan determined in accordance with SFAS 123.
The fair value of each option grant is estimated on the date of the grant using the Black-Scholes options-pricing model with the following weighted
average assumptions used for grants for the:
Years Ended December 31,
2002 2001
Dividend yield *********************************************************************** 0.68% 0.68%
Risk-free rate of return**************************************************************** 4.74% – 5.52% 5.72%
Volatility **************************************************************************** 25.3% – 30.3% 31.6%
Expected duration ******************************************************************* 4 – 6 years 4 – 6 years
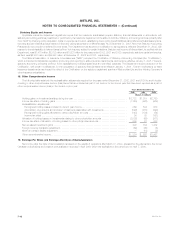
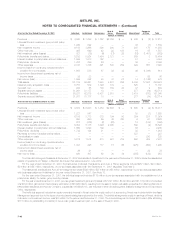
A summary of the status of options included in the Company’s Stock Incentive Plan and Directors Stock Plan is presented below:
Weighted Weighted
Average Options Average
Options Exercise Price Exercisable Exercise Price
Outstanding at December 31, 2000************************************* —$— —$—
Granted ************************************************************ 12,263,550 $29.93 — $ —
Canceled/expired **************************************************** (1,158,025) $29.95 — $ —
Outstanding at December 31, 2001************************************* 11,105,525 $29.93 — $ —
Granted ************************************************************ 7,275,855 $30.35 — $ —
Exercised *********************************************************** (11,401) $29.95 — $ —
Canceled/expired **************************************************** (2,098,821) $30.07 — $ —
Outstanding at December 31, 2002************************************* 16,271,158 $30.10 1,357,034 $30.01
Years Ended
December 31,
2002 2001
Weighted average fair value of options granted ************************************************ $10.48 $10.29
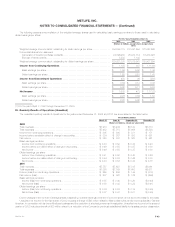
The following table summarizes information about stock options outstanding at December 31, 2002:
Number
Number Weighted Average Weighted Exercisable at Weighted
Outstanding at Remaining Contractual Average December 31, Average
Range of Exercise Prices December 31, 2002 Life (Years) Exercise Price 2002 Exercise Price
$23.75 – $26.75 28,000 9.76 $23.75 — $ —
$26.76 – $28.75 150,400 9.21 $27.36 — $ —
$28.76 – $30.75 15,887,628 8.34 $30.11 1,319,253 $29.93
$30.76 – $32.75 180,600 8.48 $31.92 13,251 $30.95
$32.76 – $33.64 24,530 9.32 $33.64 24,530 $33.64
16,271,158 8.26 $30.10 1,357,034 $30.01
MetLife, Inc. F-41