MetLife 2002 Annual Report Download - page 32
Download and view the complete annual report
Please find page 32 of the 2002 MetLife annual report below. You can navigate through the pages in the report by either clicking on the pages listed below, or by using the keyword search tool below to find specific information within the annual report.-
 1
1 -
2
-
3
-
4
-
5
-
6
-
7
-
8
-
9
-
10
-
11
-
12
-
13
-
14
-
15
-
16
-
17
-
18
-
19
-
20
-
21
-
 22
22 -
 23
23 -
 24
24 -
 25
25 -
 26
26 -
 27
27 -
 28
28 -
 29
29 -
 30
30 -
 31
31 -
 32
32 -
 33
33 -
 34
34 -
 35
35 -
 36
36 -
 37
37 -
 38
38 -
 39
39 -
 40
40 -
 41
41 -
 42
42 -
43
-
44
-
45
-
46
-
47
-
48
-
49
-
50
-
51
-
52
-
53
-
54
-
55
-
56
-
57
-
58
-
59
-
60
-
61
-
62
-
63
-
64
-
65
-
66
-
67
-
68
-
69
-
70
-
71
-
72
-
73
-
74
-
75
-
76
-
77
-
78
-
79
-
80
-
81
-
82
-
83
-
84
-
85
-
86
-
87
-
88
-
89
-
90
-
91
-
92
-
93
-
94
 |
 |

Fixed Maturities
Fixed maturities consist principally of publicly traded and privately placed debt securities, and represented 73.7% and 68.0% of total cash and
invested assets at December 31, 2002 and 2001, respectively. Based on estimated fair value, public fixed maturities represented $121,191 million, or
86.2%, and $96,579 million, or 83.7%, of total fixed maturities at December 31, 2002 and 2001, respectively. Based on estimated fair value, private fixed
maturities represented $19,362 million, or 13.8%, and $18,819 million, or 16.3%, of total fixed maturities at December 31, 2002 and 2001, respectively.
The Company invests in privately placed fixed maturities to (i) obtain higher yields than can ordinarily be obtained with comparable public market
securities, (ii) provide the Company with protective covenants, call protection features and, where applicable, a higher level of collateral, and (iii) increase
diversification. However, the Company may not freely trade its privately placed fixed maturities because of restrictions imposed by federal and state
securities laws and illiquid markets.
In cases where quoted market prices are not available, fair values are estimated using present value or valuation techniques. The fair value estimates
are made at a specific point in time, based on available market information and judgments about the financial instruments, including estimates of the
timing and amounts of expected future cash flows and the credit standing of the issuer or counter-party. Factors considered in estimating fair value
include: coupon rate, maturity, estimated duration, call provisions, sinking fund requirements, credit rating, industry sector of the issuer and quoted
market prices of comparable securities.
The Securities Valuation Office of the NAIC evaluates the fixed maturity investments of insurers for regulatory reporting purposes and assigns
securities to one of six investment categories called ‘‘NAIC designations.’’ The NAIC ratings are similar to the rating agency designations of the Nationally
Recognized Statistical Rating Organizations for marketable bonds. NAIC ratings 1 and 2 include bonds generally considered investment grade (rated
‘‘Baa3’’ or higher by Moody’s Investors Services (‘‘Moody’s’’), or rated ‘‘BBB–’’ or higher by Standard & Poor’s (‘‘S&P’’)) by such rating organizations. NAIC
ratings 3 through 6 include bonds generally considered below investment grade (rated ‘‘Ba1’’ or lower by Moody’s, or rated ‘‘BB+’’ or lower by S&P).
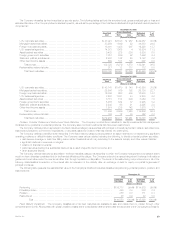
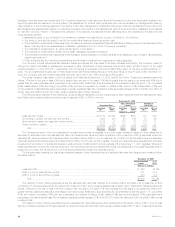
The following table presents the Company’s total fixed maturities by Nationally Recognized Statistical Rating Organizations designation and the
equivalent ratings of the NAIC, as well as the percentage, based on estimated fair value, that each designation comprises at:
December 31, 2002 December 31, 2001
Rating Agency Amortized Estimated % of Amortized Estimated % of
Designation(1) Cost Fair Value Total Cost Fair Value Total
(Dollars in millions)
Aaa/Aa/A ********************************************** $ 91,250 $ 97,495 69.4% $ 72,098 $ 75,265 65.2%
Baa *************************************************** 29,345 31,060 22.1 29,128 29,581 25.6
Ba **************************************************** 7,413 7,304 5.2 6,021 5,856 5.1
B***************************************************** 3,463 3,227 2.3 3,205 3,100 2.7
Caa and lower ****************************************** 434 339 0.2 726 597 0.5
In or near default **************************************** 430 416 0.3 327 237 0.2
Subtotal *********************************************** 132,335 139,841 99.5 111,505 114,636 99.3
Redeemable preferred stock ****************************** 817 712 0.5 783 762 0.7
Total fixed maturities ************************************* $133,152 $140,553 100.0% $112,288 $115,398 100.0%
(1) Amounts presented are based on rating agency designations. Comparisons between NAIC ratings and rating agency designations are published by
the NAIC.
Based on estimated fair values, investment grade fixed maturities comprised 91.5% and 90.8% of total fixed maturities in the general account at
December 31, 2002 and 2001, respectively.
The following table shows the amortized cost and estimated fair value of fixed maturities, by contractual maturity dates (excluding scheduled sinking
funds) at:
December 31,
2002 2001
Amortized Estimated Amortized Estimated
Cost Fair Value Cost Fair Value
(Dollars in millions)
Due in one year or less ************************************************** $ 4,592 $ 4,662 $ 4,001 $ 4,049
Due after one year through five years *************************************** 26,200 27,354 20,168 20,841
Due after five years through ten years ************************************** 23,297 24,987 22,937 23,255
Due after ten years ****************************************************** 35,507 38,452 30,778 32,248
Subtotal *********************************************************** 89,596 95,455 77,884 80,393
Mortgage-backed and asset-backed securities ******************************* 42,739 44,386 33,621 34,243
Subtotal *********************************************************** 132,335 139,841 111,505 114,636
Redeemable preferred stock ********************************************** 817 712 783 762
Total fixed maturities ************************************************* $133,152 $140,553 $112,288 $115,398
Actual maturities may differ as a result of prepayments by the issuer.
MetLife, Inc.
28