MetLife 2002 Annual Report Download - page 16
Download and view the complete annual report
Please find page 16 of the 2002 MetLife annual report below. You can navigate through the pages in the report by either clicking on the pages listed below, or by using the keyword search tool below to find specific information within the annual report.-
 1
1 -
2
-
3
-
4
-
5
-
 6
6 -
 7
7 -
 8
8 -
 9
9 -
 10
10 -
 11
11 -
 12
12 -
 13
13 -
 14
14 -
 15
15 -
 16
16 -
 17
17 -
 18
18 -
 19
19 -
 20
20 -
 21
21 -
 22
22 -
 23
23 -
 24
24 -
 25
25 -
 26
26 -
27
-
28
-
29
-
30
-
31
-
32
-
33
-
34
-
35
-
36
-
37
-
38
-
39
-
40
-
41
-
42
-
43
-
44
-
45
-
46
-
47
-
48
-
49
-
50
-
51
-
52
-
53
-
54
-
55
-
56
-
57
-
58
-
59
-
60
-
61
-
62
-
63
-
64
-
65
-
66
-
67
-
68
-
69
-
70
-
71
-
72
-
73
-
74
-
75
-
76
-
77
-
78
-
79
-
80
-
81
-
82
-
83
-
84
-
85
-
86
-
87
-
88
-
89
-
90
-
91
-
92
-
93
-
94
 |
 |

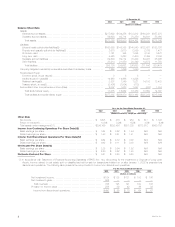
Capitalization of deferred policy acquisition costs increased to $2,039 million for the year ended December 31, 2001 from $1,863 million for the
comparable 2000 period. This variance is attributable to increases in the Individual, Reinsurance, Institutional and International segments. The growth in
the Individual segment is primarily due to higher sales of variable and universal life insurance policies and annuity and investment-type products, resulting
in additional commissions and other deferrable expenses. The increases in the Reinsurance, Institutional and International segments are commensurate
with growth in those businesses. Total amortization of deferred policy acquisition costs increased to $1,438 million in 2001 from $1,383 million in 2000.
Amortization of $1,413 million and $1,478 million are allocated to other expenses in 2001 and 2000, respectively, while the remainder of the amortization
in each year is allocated to investment gains and losses. The decrease in amortization of deferred policy acquisition costs allocated to other expenses is
attributable to a decline in the Individual segment, partially offset by increases in the Reinsurance and International segments. The decline in the Individual
segment is due to changes in the estimates of future gross margins and profits. Contributing to this variance are modifications made in the third quarter of
2001 relating to the manner in which estimates of future market performance are developed. These estimates are used in determining unamortized
deferred policy acquisition costs balances and the amount of related amortization. The modification will reflect an expected impact of past market
performance on future market performance, as well as improving the ability to estimate deferred policy acquisition costs balances and related
amortization. The increase in the Reinsurance segment is primarily due to fluctuations in allowances paid to ceding companies as a result of a change in
product mix. The increase in the International segment is due to a write-off of deferred policy acquisition costs as a result of the economic and political
events in Argentina.
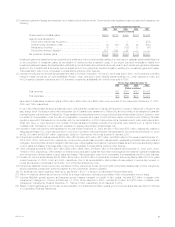
Income tax expense for the year ended December 31, 2001 was $227 million, or 37%, of income from continuing operations before provision for
income taxes, compared with $421 million, or 33%, for the comparable 2000 period. The 2001 effective tax rate differs from the federal corporate tax rate
of 35% due to an increase in prior year income taxes on capital gains. The 2000 effective tax rate differs from the federal corporate tax rate of 35%
primarily due to the payments made in the second quarter of 2000 to former Canadian policyholders in connection with the demutualization, the impact of
surplus tax and a reduction in prior year income taxes on capital gains recorded in the third quarter of 2000. This reduction is associated with the previous
sale of a business. Prior to its demutualization, the Company was subject to surplus tax imposed on mutual life insurance companies under Section 809
of the Internal Revenue Code. The surplus tax results from the disallowance of a portion of a mutual life insurance company’s policyholder dividends as a
deduction from taxable income.
In accordance with SFAS No. 144, income related to the Company’s real estate which was identified as held-for-sale on or after January 1, 2002 is
presented as discontinued operations for the years ended December 31, 2002, 2001 and 2000. The income from discontinued operations is comprised
of net investment income related to 47 properties that the Company began marketing for sale on or after January 1, 2002.
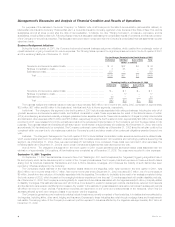
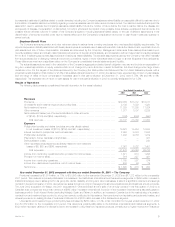
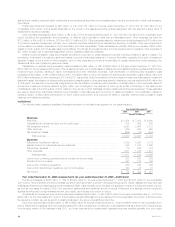
Individual
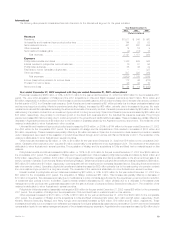
The following table presents consolidated financial information for the Individual segment for the years indicated:
Year Ended December 31,
2002 2001 2000
(Dollars in millions)
Revenues
Premiums*********************************************************************** $ 4,507 $ 4,563 $ 4,673
Universal life and investment-type product policy fees ********************************** 1,380 1,260 1,221
Net investment income *********************************************************** 6,259 6,188 6,108
Other revenues ****************************************************************** 418 495 650
Net investment (losses) gains ****************************************************** (164) 827 227
Total revenues*************************************************************** 12,400 13,333 12,879
Expenses
Policyholder benefits and claims **************************************************** 5,220 5,233 5,054
Interest credited to policyholder account balances ************************************* 1,793 1,898 1,680
Policyholder dividends ************************************************************ 1,770 1,767 1,742
Other expenses ***************************************************************** 2,629 2,747 3,012
Total expenses ************************************************************** 11,412 11,645 11,488
Income from continuing operations before provision for income taxes ********************* 988 1,688 1,391
Provision for income taxes********************************************************* 363 631 507
Income from continuing operations************************************************** 625 1,057 884
Income from discontinued operations, net of income taxes****************************** 201 38 36
Net income ********************************************************************* $ 826 $ 1,095 $ 920
Year ended December 31, 2002 compared with the year ended December 31, 2001—Individual
Premiums decreased by $56 million, or 1%, to $4,507 million for the year ended December 31, 2002 from $4,563 million for the comparable 2001
period. Premiums from insurance products decreased by $94 million, primarily resulting from a third quarter 2002 amendment of a reinsurance
agreement to increase the amount of insurance ceded from 50% to 100%. This amendment was effective January 1, 2002. The Company also believes
the decline is the result of a continued shift in policyholders’ preference from traditional policies to annuity and investment-type products. These
decreases are partially offset by policyholders expanding their traditional life insurance coverage through the purchase of additional insurance with
dividend proceeds in 2002. Premiums from annuity products increased by $38 million as a result of higher sales of fixed annuities and supplementary
contracts with life contingencies.
Universal life and investment-type product policy fees increased by $120 million, or 10%, to $1,380 million for the year ended December 31, 2002
from $1,260 million for the comparable 2001 period. Policy fees from insurance products increased by $145 million primarily due to higher revenue from
insurance fees, which increase as the average separate account asset base supporting the underlying minimum death benefit declines. The average
separate account asset base has declined in response to poor equity market performance. Additionally, this variance reflects the acceleration of the
recognition of unearned fees associated with future reinsurance recoveries. Policy fees from annuity and investment-type products decreased by
$25 million primarily due to declines in the average separate account asset base resulting generally from poor equity market performance, partially offset
MetLife, Inc.
12